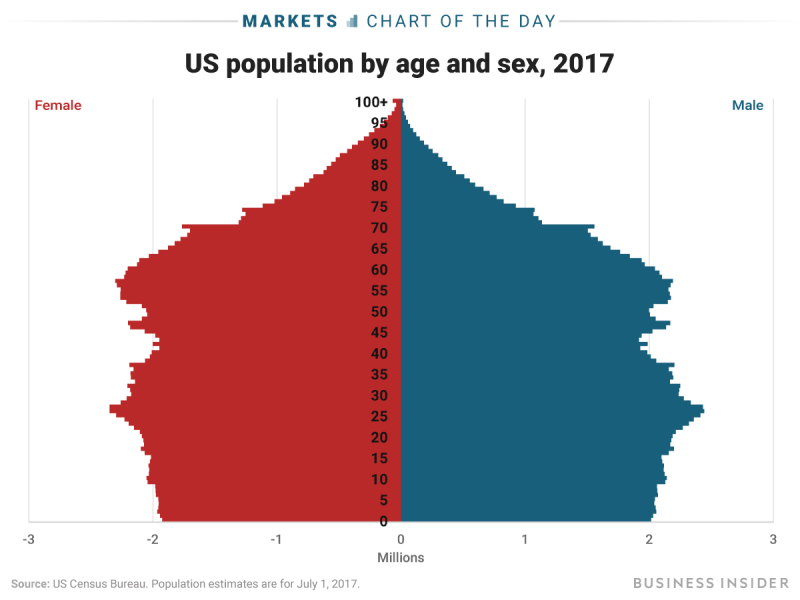
- The US Census Bureau recently released estimates of the 2017 US population by sex and year of age.
- That demographic data is often represented in a population pyramid.
- The US population pyramid clearly shows the aging baby boomer generation and the maturing millennial generation.
America as a whole is getting older, and the millennial generation is coming up on its prime economic years.
The US Census Bureau on Thursday released its estimates of the 2017 US population by sex for each year of age. One of the most common ways to illustrate that kind of demographic data is through a population pyramid, or a chart with a horizontal bar showing the number of male and female residents at each year of age.
The US population pyramid clearly shows the two largest generations of Americans: the baby boomers, born between about 1946 and 1964, and so between the ages of 53 and 71 in 2017; and the millennials, born between about 1981 and 1996, falling between the ages of 21 and 36 in 2017.
Twenty-six was the most widely represented age in 2017, with an estimated 4,794,326 Americans of that age on July 1, when the data was taken.
The demographic pyramid for the US has consequences for the country's economic future, as the boomers continue to move into retirement and millennials enter their prime working and spending years.
Here's the estimated US population broken down by sex and year of age as of July 1, 2017.


