Oklahoma Attorney General Scott Pruitt, who Donald Trump has picked to lead the EPA, has spent much of his career fighting the very agency he is likely to lead. He has challenged the EPA in court multiple times, and is currently part of the group of attorneys general suing over the Clean Power Plan.
Pruitt has often offered an economic argument to justify his opposition to Obama-era EPA rules. He and many other opponents of environmental regulation adhere to the theory that as economies grow, so must carbon emissions. Energy is essential for economic development, the logic goes, and the vast majority of our energy comes from fossil fuels, which produce greenhouse gasses.
Critics often use this reasoning to argue that EPA requirements to lower emissions – like those proposed in the Clean Power Plan – hurt the economy.
“The American people are tired of seeing billions of dollars drained from our economy due to unnecessary EPA regulations,” Pruitt said in a statement December 8.
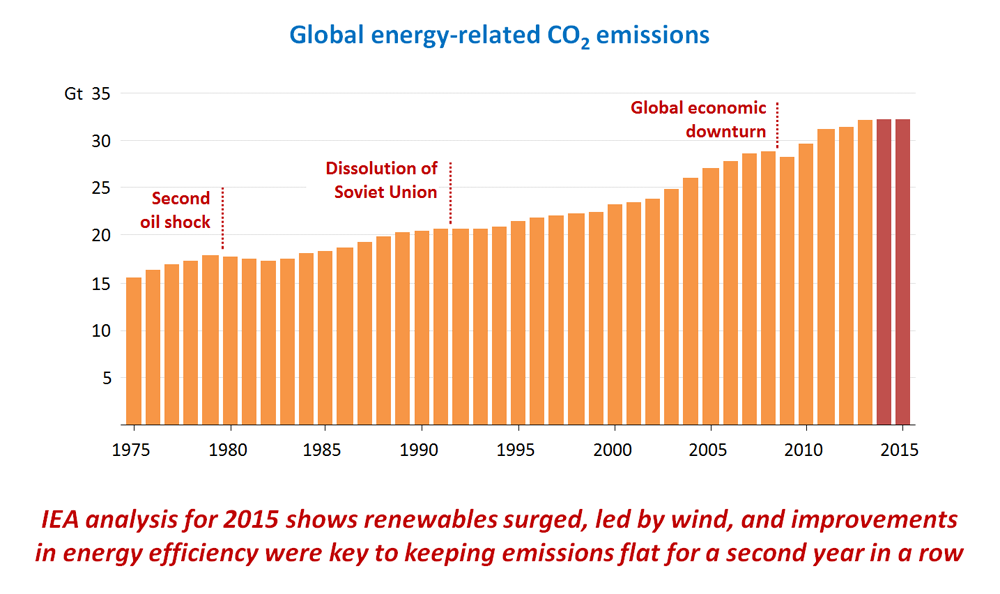
But in the last two years, the US and countries around the world hit a remarkable milestone: the global economy grew while carbon dioxide emissions stayed the same. Energy experts refer to the weakening link between economic and emissions growth as "decoupling."
A new report from the Brookings Institution looks into the same dynamic on a state level, comparing GDP growth between 2000 and 2014 with energy-related carbon emissions in all 50 states and Washington DC during the same period.
Their findings show that more than 30 states have de-linked their growth and emissions, confirming that "cleaning up the economy doesn't necessarily put an end to growth."
Here's the data.
Global decoupling since 2000
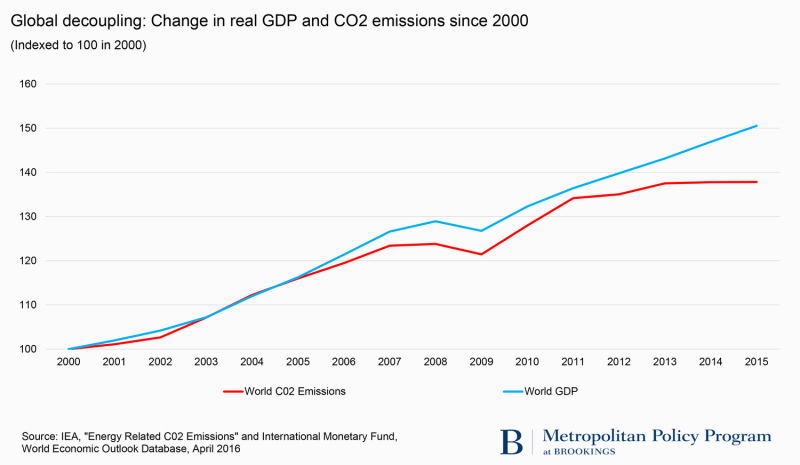
An analysis by the World Resources Institute found that 35 countries, including the US, reduced emissions while growing their economies between 2000 and 2014. The United Kingdom reduced its emissions while growing its economy by 27%. Singapore doubled its GDP while cutting its carbon emissions by 46%.
Dissenters could still suggest that these countries' recent growth might have been even higher if emissions were regulated even less. But the chart suggests the global economy is continuing to see growth while emissions level off.
US decoupling since 2000
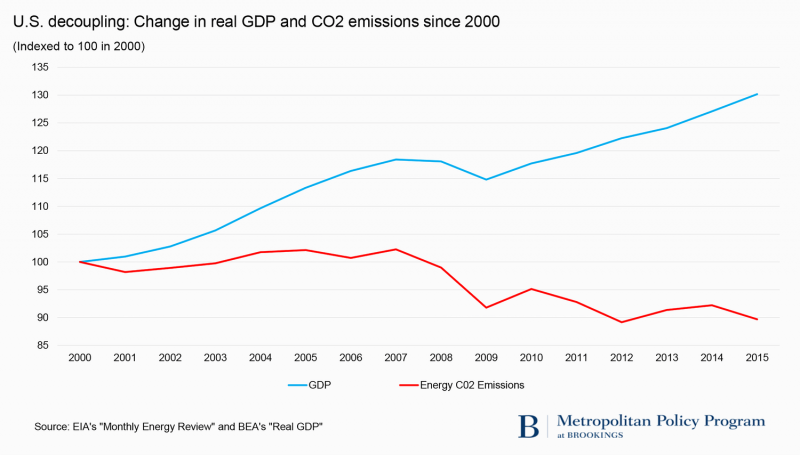
According to the report, the US expanded its GDP by 30% between 2000 and 2015 while cutting its emissions by 10%. That makes it the largest country to achieve a decoupling of economic growth and carbon emissions.
"Many states have managed similar feats, which in turn confirms the compatibility of economic growth and emissions reductions and counters the Trump-style skepticism," the report says.
State economic growth compared to carbon emissions
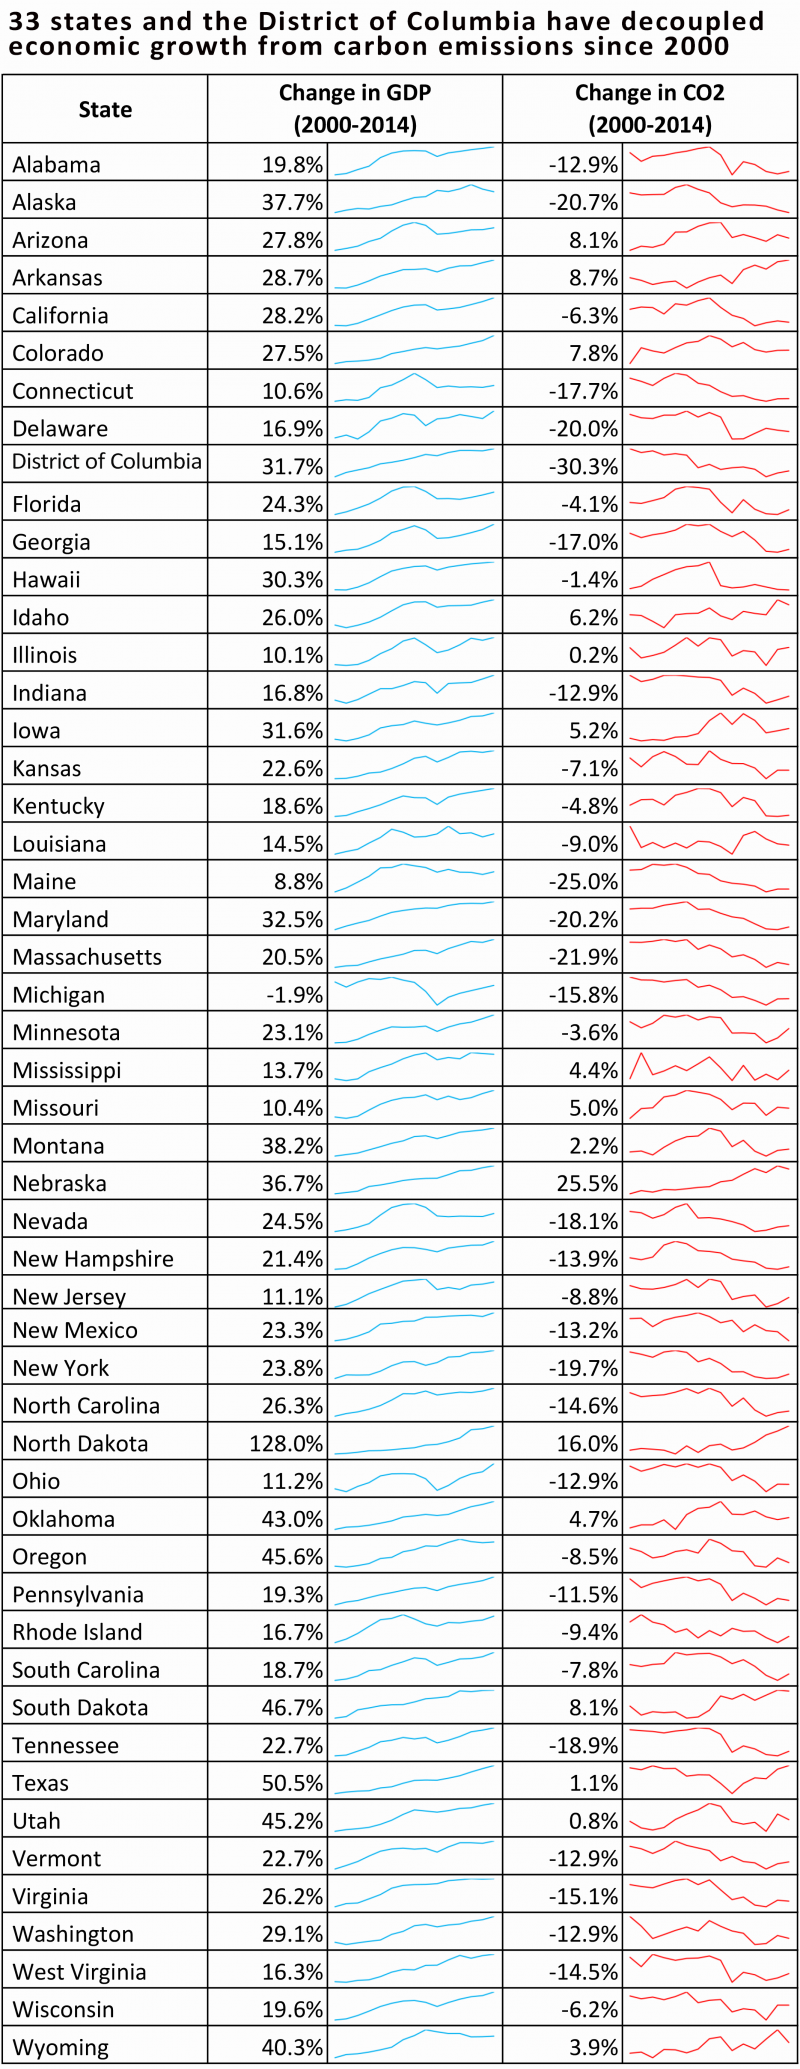
Overall, the majority of US states (33 plus Washington DC) have managed to expand their economies while cutting emissions. As a group, the states who experienced this decoupling expanded their economies by 22% while reducing their emissions by nearly 12%.
Maine saw the biggest carbon drop - 25% - and still grew its economy by 9%. And Massachusetts cut its emissions by 22% while its GDP grew 21%.
The report suggests that much of this decrease comes from the declining use of coal. As hydraulic fracturing has made natural gas cheaper and more accessible, coal-burning power plants are increasingly being replaced with natural gas plants (which are cleaner).
This data suggests that it is possible for state-level policies to continue reducing US emissions.
"Given their substantial powers to encourage emissions decoupling, states and cities are crucial players in the carbon drama," the report says.
Carbon emissions reductions by state
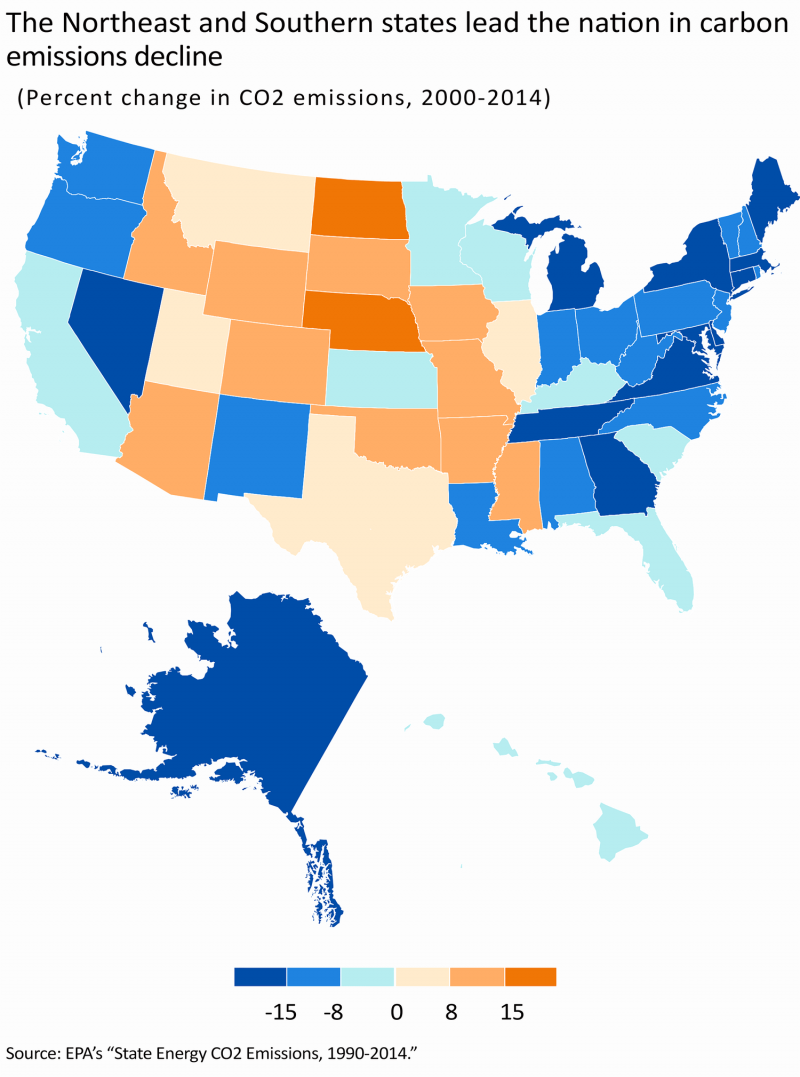
Eight of the 10 states with the country's highest GDP are all in the blue range, according to this chart. (The exceptions are Texas and Illinois.) That means that most of the country's economic powerhouse states have reduced their emissions over the last 15 years.
Though it may seem surprising that California is not among the leaders in emissions decreases, the report explains that the state wasn't using much coal at the beginning of the time period studied and wasn't able to gain the emissions reductions other states did.
"Thus, labeling California a 'weak' decoupler during the study period does the state something of a disservice given its past progress, history of low-carbon policy, and low carbon emissions per capita," it explains.
Decarbonization rate by state
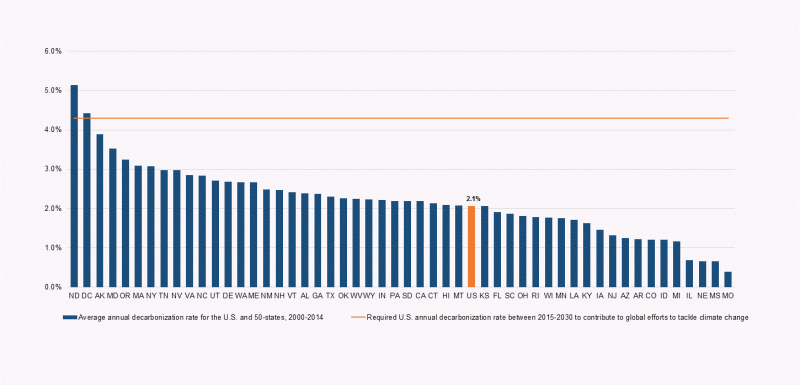
Carbon intensity is a measure of CO2 emissions per dollar of GDP in a given country or state. The decarbonization rate is how much that carbon intensity has decreased. Though not all states have decreased their emissions (16 saw increases between 2000 and 2014), this chart shows that all 50 states and Washington DC have lowered their carbon intensity to some degree.
Most state economies - and the country overall - have not, however, reached the rate of decarbonization necessary to keep the world's temperature from rising more than 2 degrees Celsius (the ceiling set by the Paris climate agreement). To achieve that, the US economy would have to decarbonize by 4.3% per year from now until 2030. From 2000 to 2014, however, we only hit an average of 2.1%.
That means there's a significant amount of work to do. And even though, as the report states, "Trump's notion of an opposition between economic growth and environmental stewardship appears to be a false one," his history of climate change denial and threat to pull the US out of the Paris agreement makes it unlikely that much environmental leadership will happen on a federal level.
The report suggests it is possible, however, for the current momentum to continue if the right policies are pursued on a state level. "State and regional actors will need to fill the vacuum created by Washington's abdication of leadership with new energy and resolve," it says.

