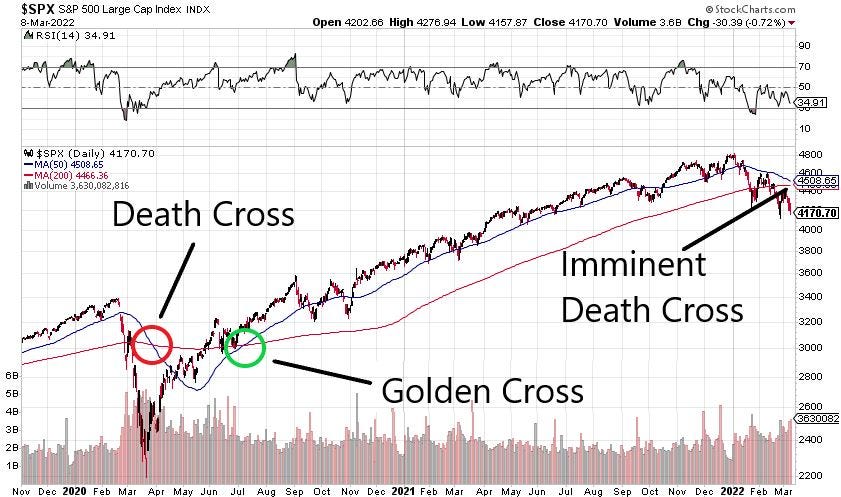
- The stock market is set to trigger a widely followed technical sell signal, suggesting more downside ahead.
- The "death cross" is a moving average crossover strategy that some traders use as a signal to sell a security.
- The death cross is triggered when the short-term 50-day moving average crosses below the long-term 200-day moving average.
A closely followed technical sell signal is about to be triggered in the S&P 500 for the first time in two years, suggesting there's more downside ahead for the stock market.
The "death cross" is a moving average crossover strategy employed by some traders and technical analysts as a signal to sell a security. The signal occurs when the short-term 50-day moving average crosses below the long-term 200-day moving average.
The lagging indicator can help alert traders to securities that are solidifying their downtrend and are likely to experience a continuation with lower stock prices.
While the S&P 500 is set to complete a death cross by next week, the Nasdaq 100 already flashed the signal on March 1. Since the Nasdaq's death cross, the tech-heavy index has fallen by 7% as of Tuesday's close. Meanwhile, the Dow Jones Industrial Average experienced a death cross on March 8.
The opposite signal to the death cross is the golden cross, which is a buy signal that triggers when the 50-day moving average crosses above the 200-day moving average.
But given that the technical moving average crossover strategy is a lagging indicator, it does not always prove to be fruitful for the traders who follow it.
For example, the last time the S&P 500 flashed a death cross was on March 30, amid the coronavirus-induced market sell-off. But that occurred closer to the bottom in the market than the top, and stocks went on to rally more than 20% before flashing the bullish golden cross signal.
The same scenario occurred in December 2018, as a death cross in the S&P 500 materialized amid a growth scare and an interest rate hike from the Federal Reserve. That, once again, occurred near the bottom for the stock market, which ultimately went on to rally and subsequently flash a golden cross buy signal.
Again, in late 2015 and early 2016, a death cross that materialized in the S&P 500 happened closer to the bottom in the market than the top, meaning investors that followed the signal and sold were forced to buy back at higher levels once the golden cross occurred and invalidated the prior death cross.
The lagging nature of the moving average crossover strategy highlights the fact that these buy and sell signals often throw off false positives, leaving traders who follow them prone to whiplash.
But when the signal does work, it works in a big way. For example, traders that followed the S&P 500's death cross in late 2007 entirely avoided the 2008 Great Financial Crash, which saw the index lose 50% of its value from peak-to-trough. And when the golden cross signal flashed in 2009, traders were able to buy the S&P 500 at a 40% discount from its prior peak.
And again during the dot-com bubble, traders that followed the September 2000 death cross in the Nasdaq 100 would have avoided a more than 70% decline over the next two years.
Still, one technical analyst that doesn't employ the moving average crossover signal is Katie Stockton of Fairlead Strategies. "I am not a proponent of using moving average crossovers for market timing/predictive value. They are often untimely, and simply tell us what we already know, that momentum has shifted," she told Insider.
Ultimately, moving average crossover signals are not perfect. And while all big sell-offs in the stock market start with a death cross, not all death crosses lead to a big decline in the stock market.

