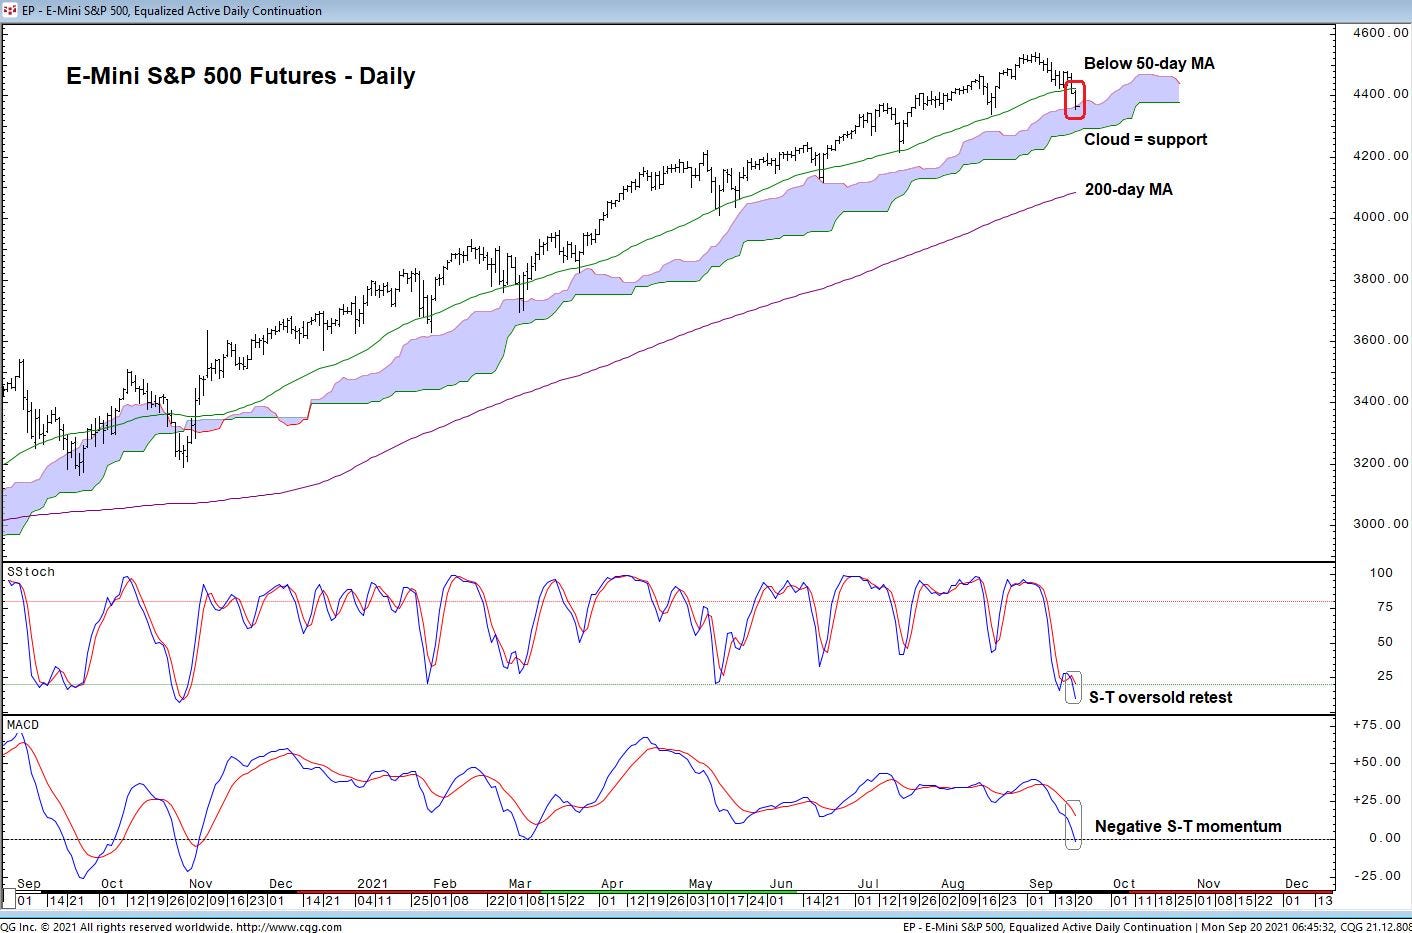
- Risk-off selling in stocks and crypto could lead to a new regime of higher volatility and more pullbacks in the S&P 500.
- "The breakdown is associated with a negative short-term momentum reading from the daily MACD indicator, the first of its kind year-to-date," Fairlead's Katie Stockton said.
- Stockton sees initial support for the S&P 500 at 4,322, representing 2% downside from Friday's close.
- Sign up here for our daily newsletter, 10 Things Before the Opening Bell.
Markets may be entering a new regime of higher volatility amid risk-off selling in stocks and cryptocurrencies, technical analyst Katie Stockton of Fairlead Strategies said in a note on Monday.
Stocks were down nearly 2% in early Monday trades amid the ongoing fallout from the Evergrande debt crisis, while bitcoin and ether both fell about 5%.
Stockton is keeping a close eye on Monday's price action, which could mark a confirmed breakdown below the 50-day moving average for the S&P 500 with its near 2% sell-off. The S&P 500 hasn't seen two consecutive daily closes below its 50-day moving average since last October, when the index staged a 9% sell-off.
In the short-term, Stockton sees support for the S&P 500 around 4,322, representing potential downside of 2.5% from Friday's close, and a further 1% decline from Monday morning levels.
But longer-term, the breakdown in stocks and crypto could welcome a new regime of higher volatility that's characterized by more frequent pullbacks in the stock market. Stockton is monitoring the VIX to indicate if this new regime is upon investors. The stock market's "fear gauge" is hovering above the 25 threshold.
"As with all breakdowns, we would await confirmation (at today's close) before acting on it, given the market's propensity to shakeouts," Stockton said. While Stockton awaits daily consecutive closes below the S&P 500's 50-day moving average, and daily consecutive closes above the 25 level for the VIX, she notes that short-term momentum indicators are flashing negative for the first time this year.
"This should make it more difficult for short-term oversold conditions to elicit a bounce," Stockton said, adding that the sell-off is coming amid a weak seasonal period for the month of September.
If the S&P 500 fails to find support near the 4,322 level, investors will likely keep an eye on the rising 200-day moving average for the next big level of support. That level is currently around 4,100, representing potential downside of 7% from Friday's close.

