- Popular jobs can vary by state based on occupation distribution.
- For geographical and economic reasons, certain jobs are concentrated in different pockets of the United States.
- The Bureau of Labor Statistics provides data on what jobs are disproportionately concentrated in each state.
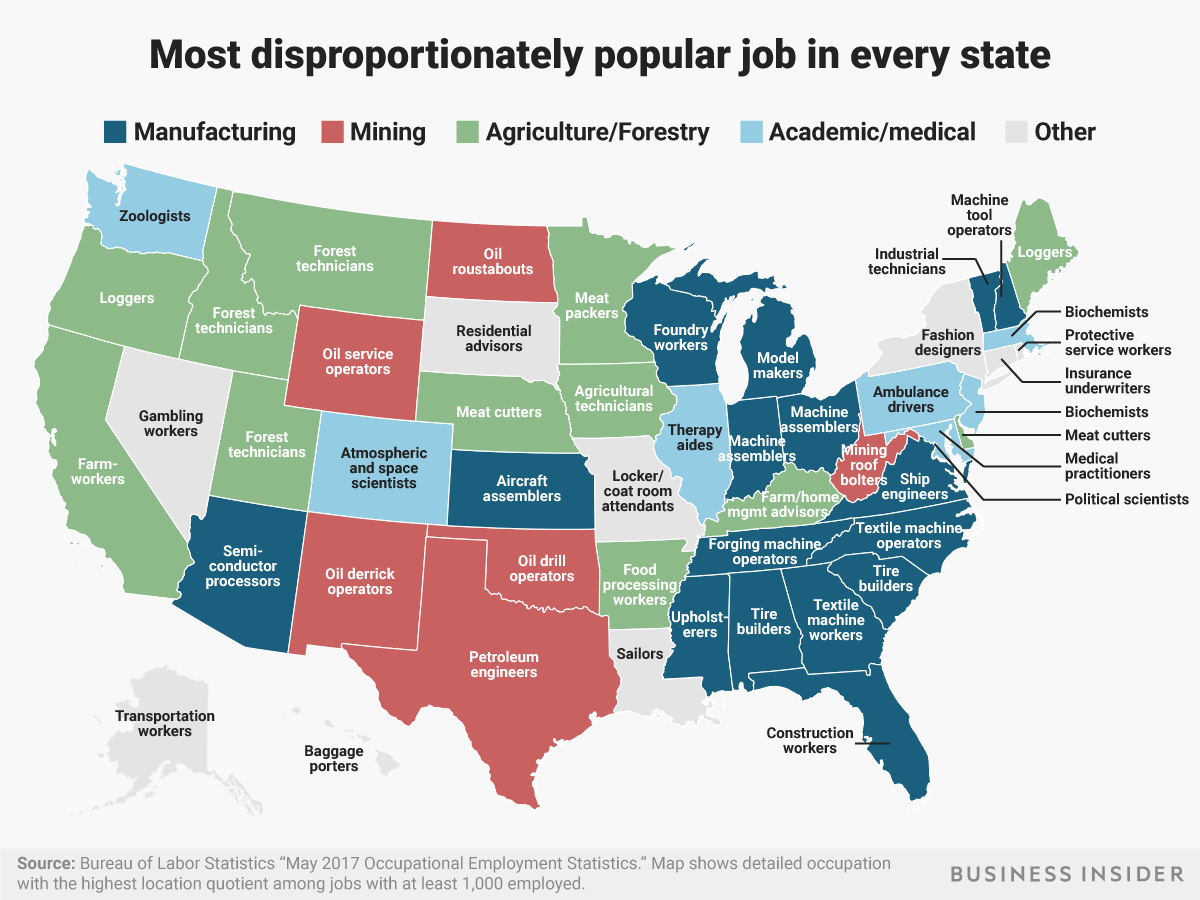
- New Yorkers are more likely to be fashion designers than workers in the US overall, and a higher proportion of Texans are petroleum engineers.
The United States is as diverse as it is large.
Colloquialisms, cuisines, and dialects are all regionally dependent. Values, religions, and even occupations are clustered according to geography.
For geographical reasons, certain jobs are concentrated in different pockets of the United States. The environment dictates where certain jobs can be due to the location of natural resources like oil, coal, or natural gas. Careers in shipping and marine engineering obviously require proximity to bodies of water. In the same vein, agricultural occupations rely on sprawling farmland for crop growing.
Using recently released data from the US Bureau of Labor Statistics, we took a look at the most overrepresented job in each state and Washington, DC, among professions with at least 1,000 employees in the state. Each of these states has more people working these jobs per capita than the nation as a whole. This is not the most common job in every state - that would be far less interesting, as the most common job in 38 states is retail salesperson.
Instead, these jobs have a bigger share in total employment in a particular state than they do in the US.
For example, Texas has about 17,840 petroleum engineers out of 11,890,880 total employed persons, according to the BLS' estimates. That means about 15 out of every 10,000 employed Texans are petroleum engineers.
Meanwhile, petroleum engineers account for 32,010 jobs in the US, out of 142,549,250 total employees. That means about 2.2 out of every 10,000 employed Americans are petroleum engineers.
The BLS calls the ratio of these two rates the "location quotient" for a job in a particular area. The location quotient for petroleum engineers in Texas, then, is 15/2.2, or about 6.7. That is, there are about 6.7 times as many petroleum engineers per 10,000 workers in Texas as there are in the US as a whole.
Here's the most disproportionately popular job the highest location quotient among jobs with at least 1,000 employees in every state and Washington, DC:
ALABAMA: Tire Builders
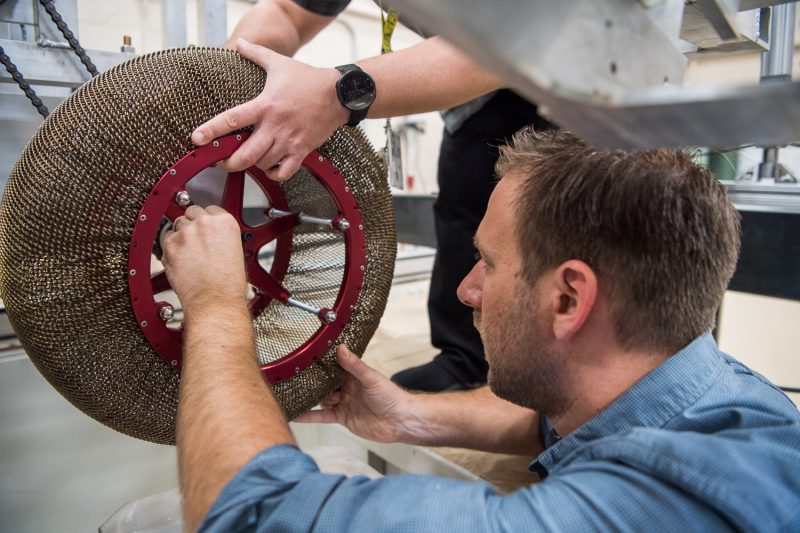
Number employed: 2,040Employment per 1,000 workers: 1.06
ALASKA: Transportation Workers, All Other

Number employed: 1,180Employment per 1,000 workers: 3.71
ARIZONA: Semiconductor Processors

Number employed: 1,880Employment per 1,000 workers: 0.69
ARKANSAS: Food Processing Workers, All Other
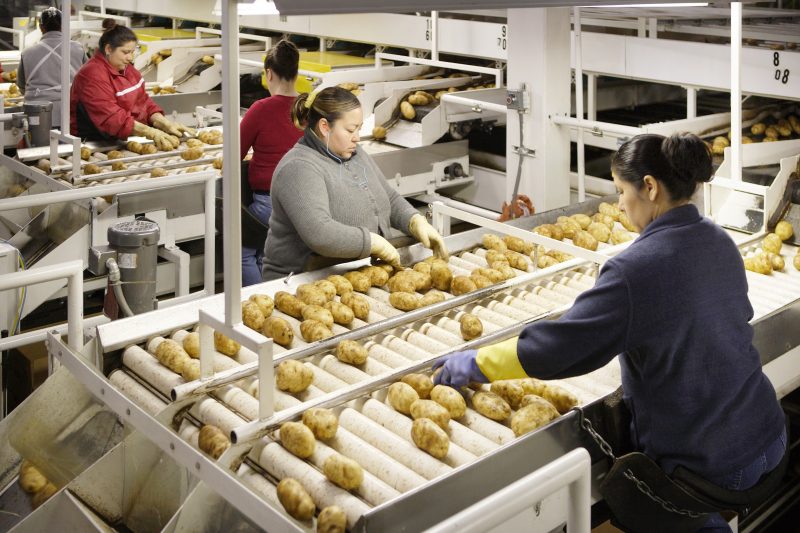
Number employed: 4,080 Employment per 1,000 workers: 3.40
CALIFORNIA: Farmworkers and Laborers

Number employed: 189,930Employment per 1,000 workers: 11.38
COLORADO: Atmospheric and Space Scientists
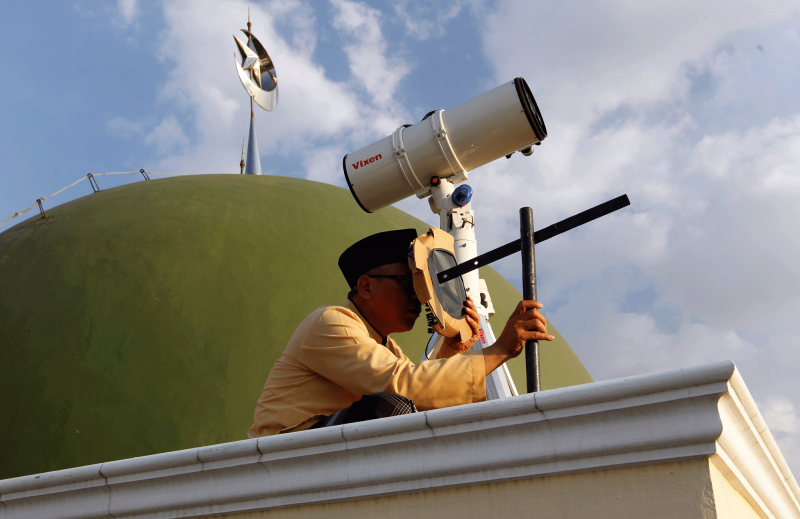
Number employed: 1,180Employment per 1,000 workers: 0.46
CONNECTICUT: Insurance Underwriters

Number employed: 2,790Employment per 1,000 workers: 1.69
DELAWARE: Meat, Poultry, and Fish Cutters and Trimmers
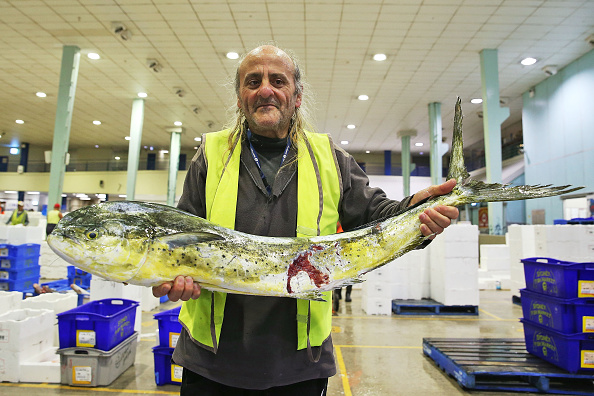
Number employed: 5,350Employment per 1,000 workers: 12.09
DISTRICT OF COLUMBIA: Political Scientists

Number employed: 3,670Employment per 1,000 workers: 5.19
FLORIDA: Miscellaneous Construction Workers

Number employed: 10,580Employment per 1,000 workers: 1.26
GEORGIA: Textile Machine Workers

Number employed: 11,900Employment per 1,000 workers: 2.76
HAWAII: Baggage Porters and Bellhops

Number employed: 1,530Employment per 1,000 workers: 2.42
IDAHO: Forest and Conservation Technicians

Number employed: 2,240Employment per 1,000 workers: 3.27
ILLINOIS: Occupational Therapy Aides
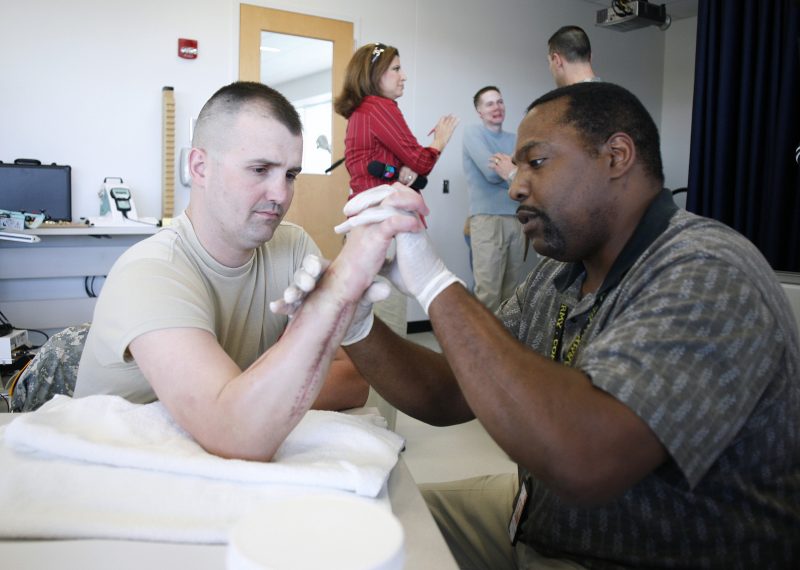
Number employed: 2,250Employment per 1,000 workers: 0.38
INDIANA: Engine and Other Machine Assemblers
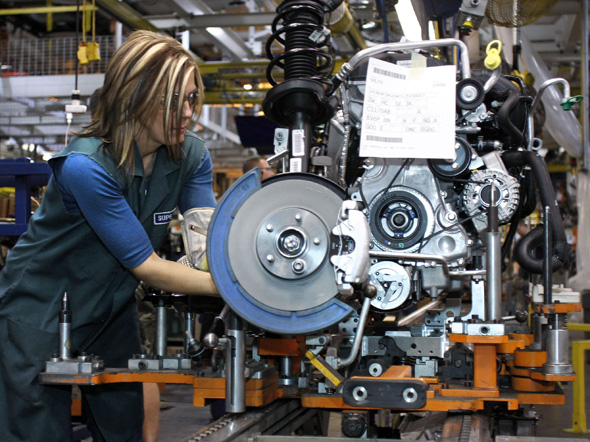
Number employed: 4,310Employment per 1,000 workers: 1.43
IOWA: Agricultural and Food Science Technicians

Number employed: 1,790Employment per 1,000 workers: 1.17
KANSAS: Aircraft Assemblers
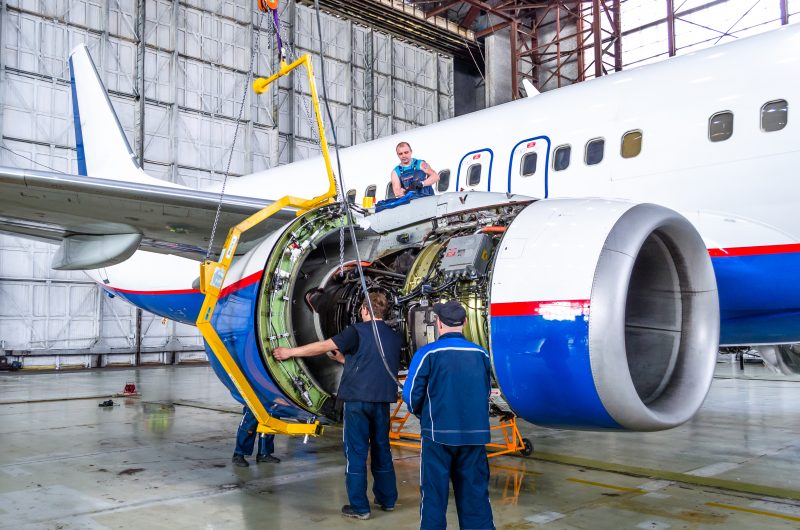
Number employed: 7,870Employment per 1,000 workers: 5.75
KENTUCKY: Farm and Home Management Advisors
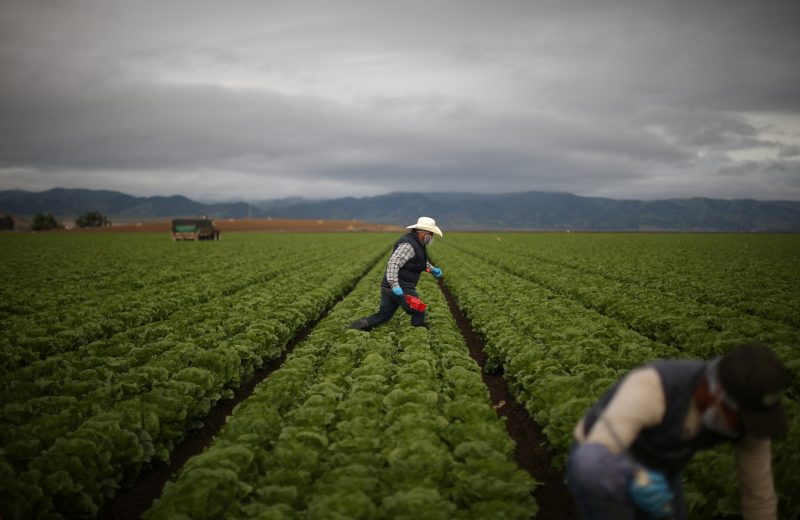
Number employed: 1,150Employment per 1,000 workers: 0.61
LOUISIANA: Sailors and Marine Oilers
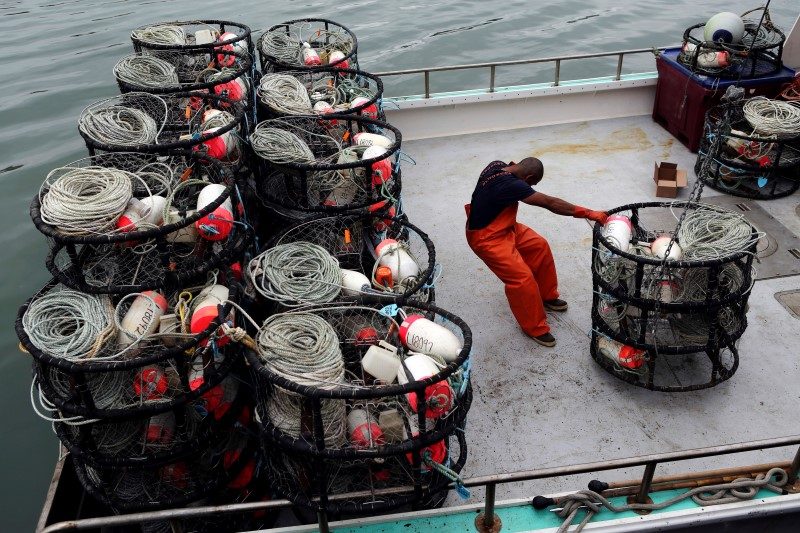
Number employed: 6,220Employment per 1,000 workers: 3.27
MAINE: Logging Equipment Operators
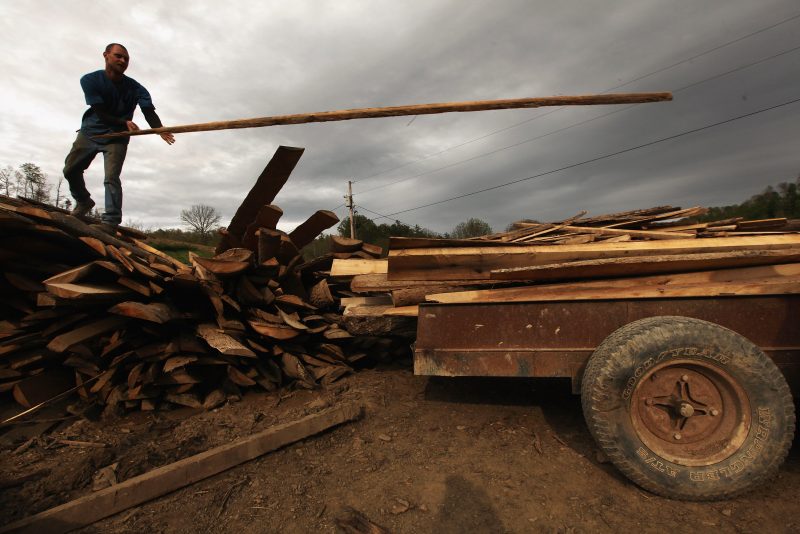
Number employed: 1,080Employment per 1,000 workers: 1.80
MARYLAND: Health Diagnosing and Treating Practitioners, All Other

Number employed: 5,510Employment per 1,000 workers: 2.07
MASSACHUSETTS: Biochemists and Biophysicists

Number employed: 4,100Employment per 1,000 workers: 1.16
MICHIGAN: Model Makers, Metal and Plastic
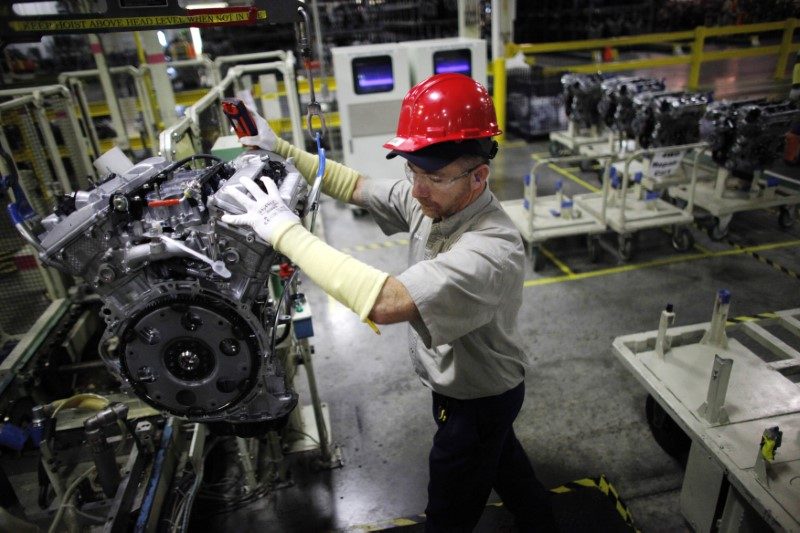
Number employed: 1,630Employment per 1,000 workers: 0.38
MINNESOTA: Slaughterers and Meat Packers
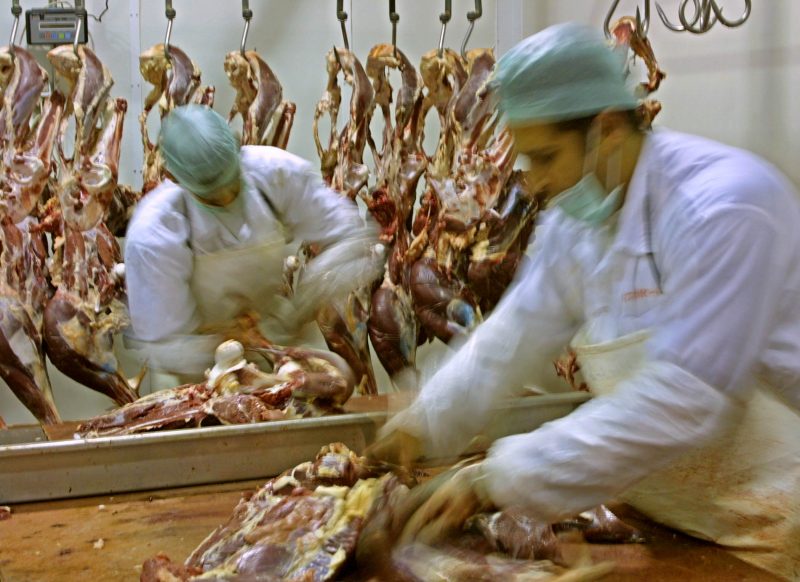
Number employed: 6,050Employment per 1,000 workers: 2.13
MISSISSIPPI: Upholsterers

Number employed: 3,460Employment per 1,000 workers: 3.09
MISSOURI: Locker Room, Coatroom, and Dressing Room Attendants

Number employed: 1,770Employment per 1,000 workers: 0.63
MONTANA: Forest and Conservation Technicians

Number employed: 2,140Employment per 1,000 workers: 4.64
NEBRASKA: Meat, Poultry, and Fish Cutters and Trimmers
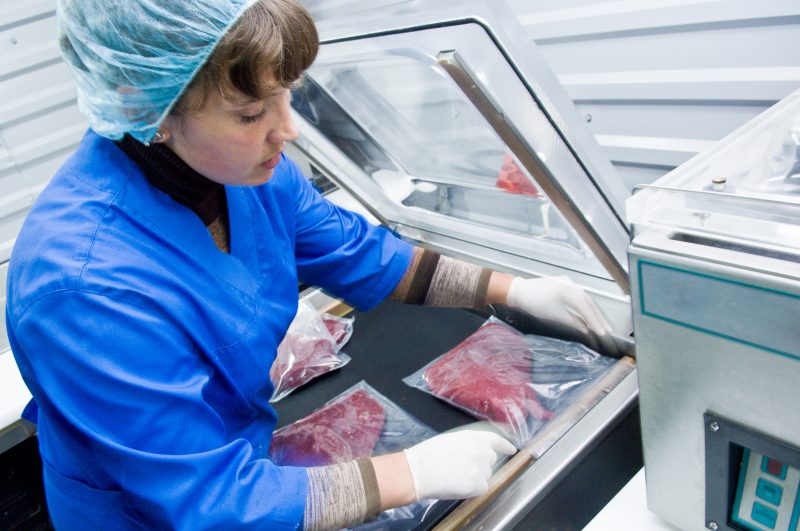
Number employed: 9,450Employment per 1,000 workers: 9.74
NEVADA: Gaming Service Workers, All Other

Number employed:3,310Employment per 1,000 workers: 2.52
NEW HAMPSHIRE: Computer-Controlled Machine Tool Operators, Metal and Plastic

Number employed: 2,620Employment per 1,000 workers: 4.03
NEW JERSEY: Biochemists and Biophysicists

Number employed: 5,150Employment per 1,000 workers: 1.29
NEW MEXICO: Derrick Operators, Oil and Gas
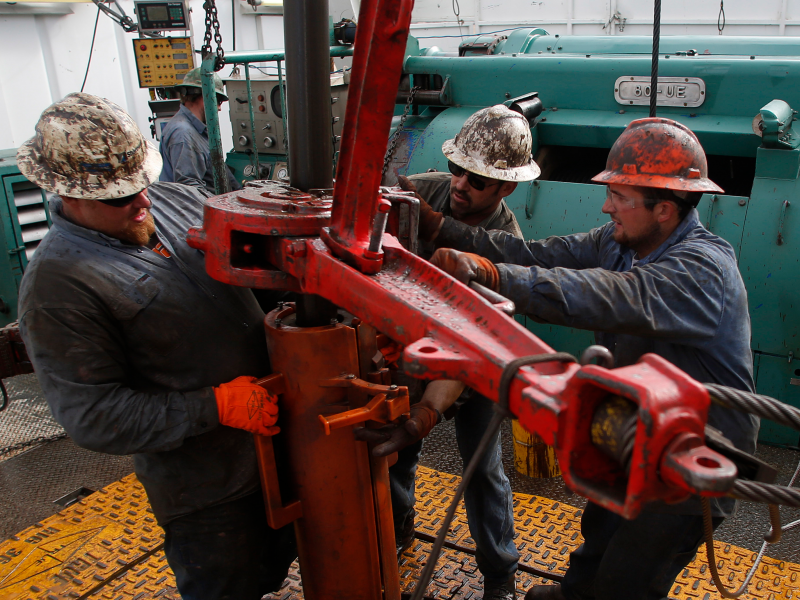
Number employed: 1,160Employment per 1,000 workers: 1.45
NEW YORK: Fashion Designers

Number employed: 6,710Employment per 1,000 workers: 0.73
NORTH CAROLINA: Textile Machine Operators
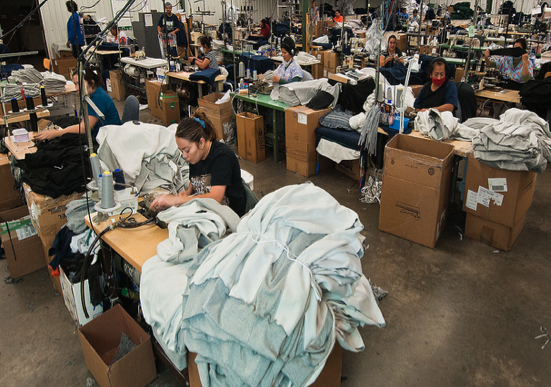
Number employed: 2,350Employment per 1,000 workers: 0.55
NORTH DAKOTA: Roustabouts, Oil and Gas
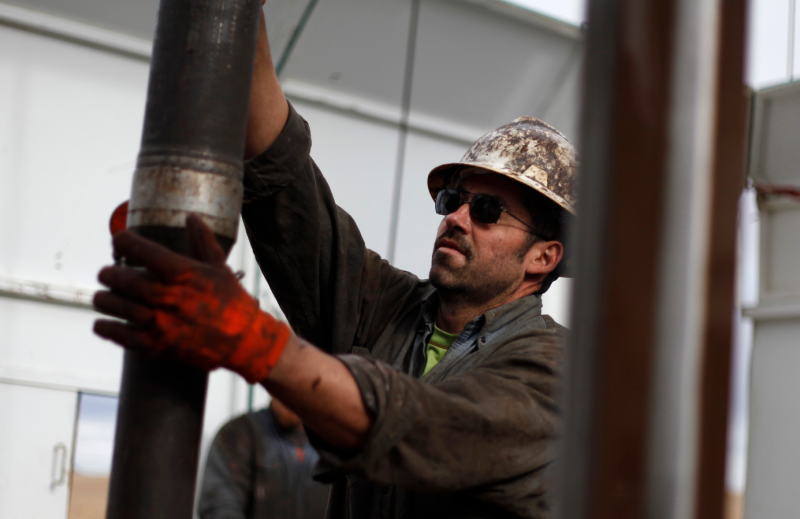
Number employed: 3,070Employment per 1,000 workers: 7.37
OHIO: Engine and Other Machine Assemblers
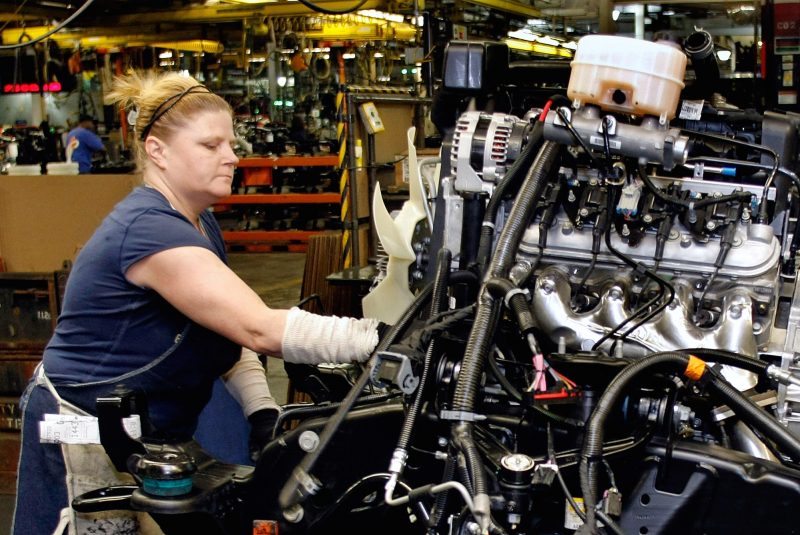
Number employed: 7,310Employment per 1,000 workers: 1.36
OKLAHOMA: Rotary Drill Operators, Oil and Gas
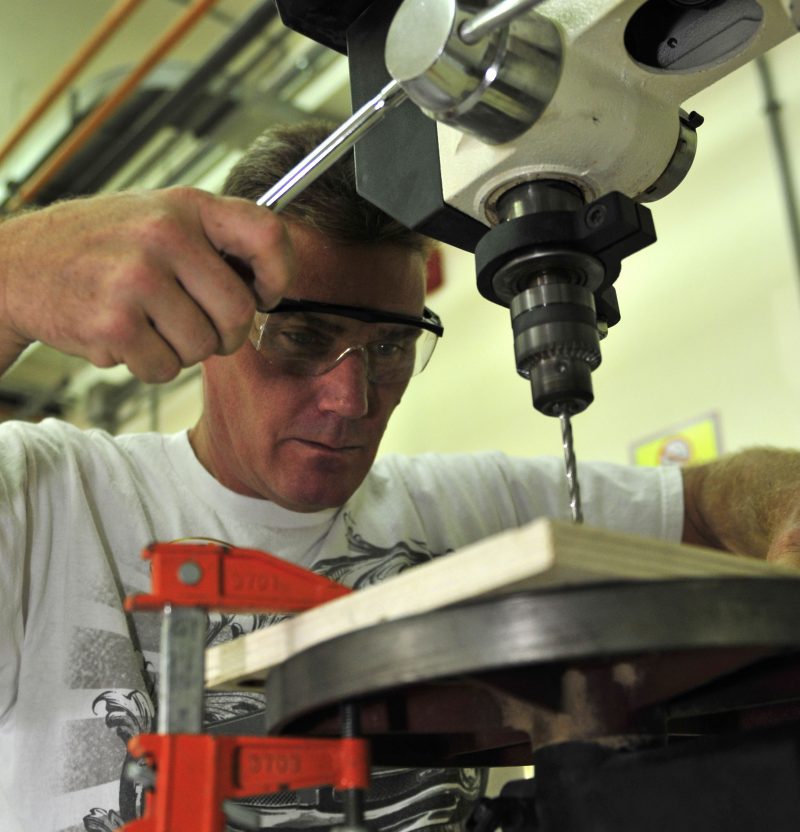
Number employed: 1,800Employment per 1,000 workers: 1.14
OREGON: Logging Workers, All Other
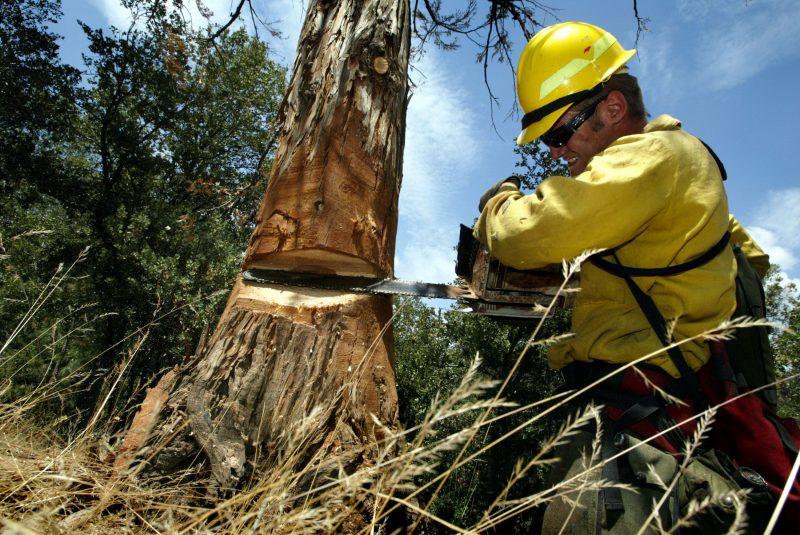
Number employed: 1,390Employment per 1,000 workers: 0.76
PENNSYLVANIA: Ambulance Drivers and Attendants, Ex. EMTs

Number employed: 2,270Employment per 1,000 workers: 0.39
RHODE ISLAND: Protective Service Workers, All Other
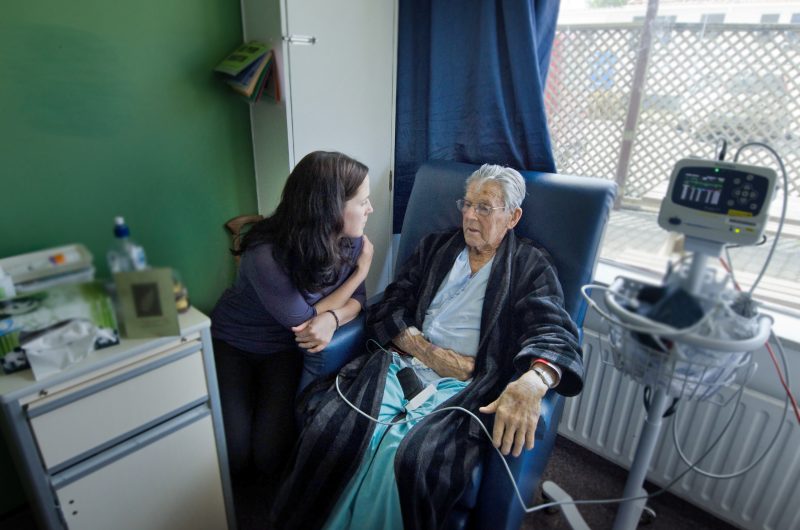
Number employed: 1,600Employment per 1,000 workers: 3.37
SOUTH CAROLINA: Tire Builders
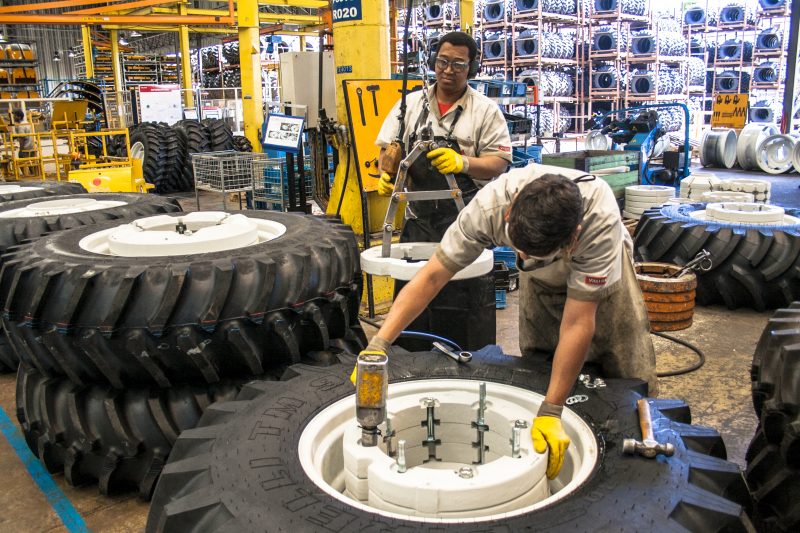
Number employed: 4,200Employment per 1,000 workers: 2.09
SOUTH DAKOTA: Residential Advisors

Number employed: 2,390Employment per 1,000 workers: 5.69
TENNESSEE: Forging Machine Setters, Operators, and Tenders, Metal and Plastic

Number employed: 2,740Employment per 1,000 workers: 0.94
TEXAS: Petroleum Engineers
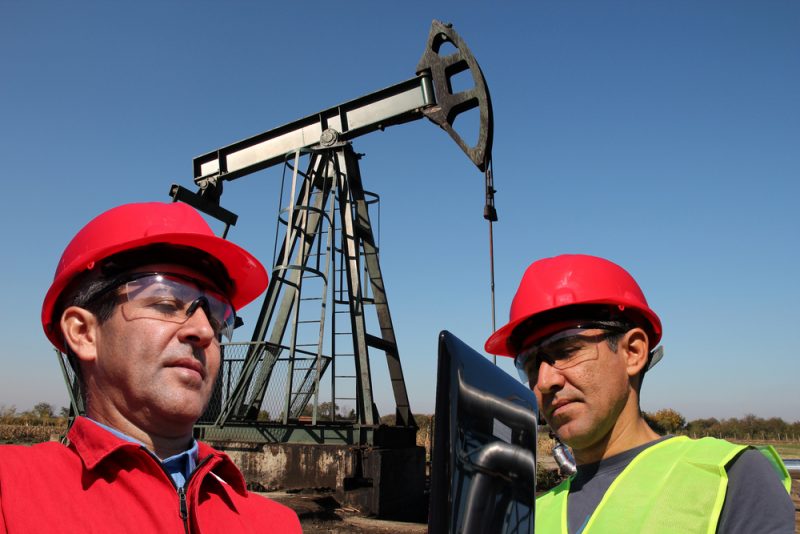
Number employed: 17,840Employment per 1,000 workers: 1.50
UTAH: Forest and Conservation Technicians
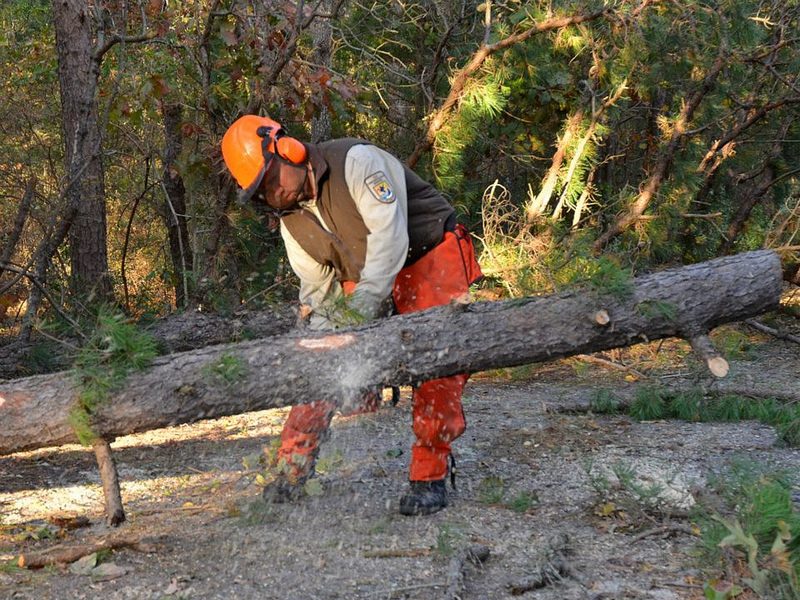
Number employed: 1,380Employment per 1,000 workers: 0.98
VERMONT: Industrial Engineering Technicians

Number employed: 1,520Employment per 1,000 workers: 4.99
VIRGINIA: Ship Engineers
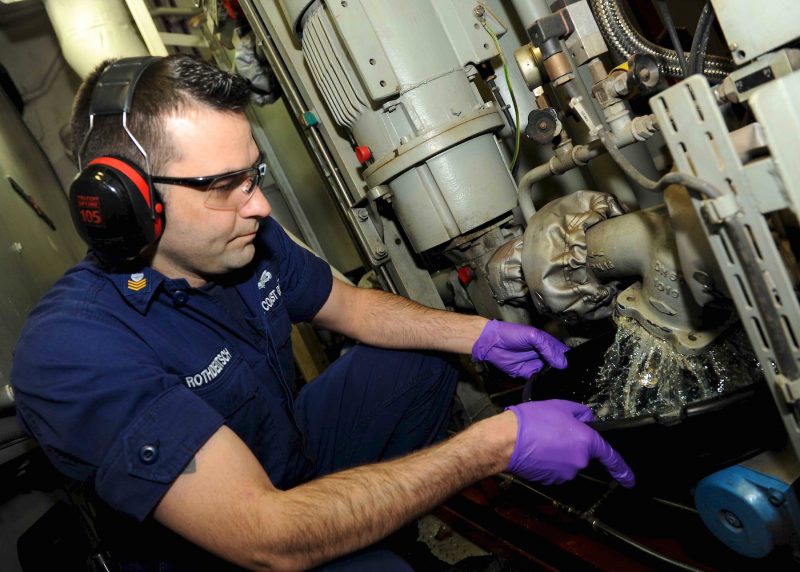
Number employed: 1,400Employment per 1,000 workers: 0.37
WASHINGTON: Zoologists and Wildlife Biologists
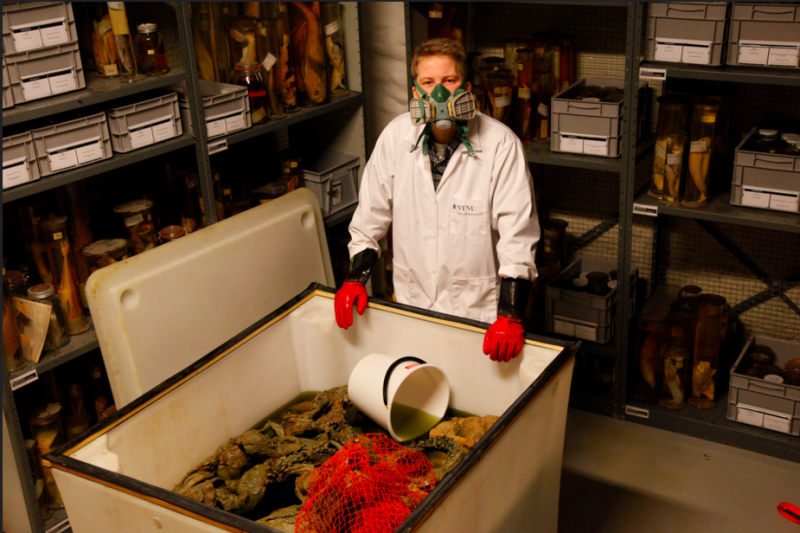
Number employed: 2,260Employment per 1,000 workers: 0.71
WEST VIRGINIA: Roof Bolters, Mining

Number employed: 1,350Employment per 1,000 workers: 1.96
WISCONSIN: Foundry Mold and Coremakers

Number employed: 1,780Employment per 1,000 workers: 0.63
WYOMING: Service Unit Operators, Oil, Gas, and Mining
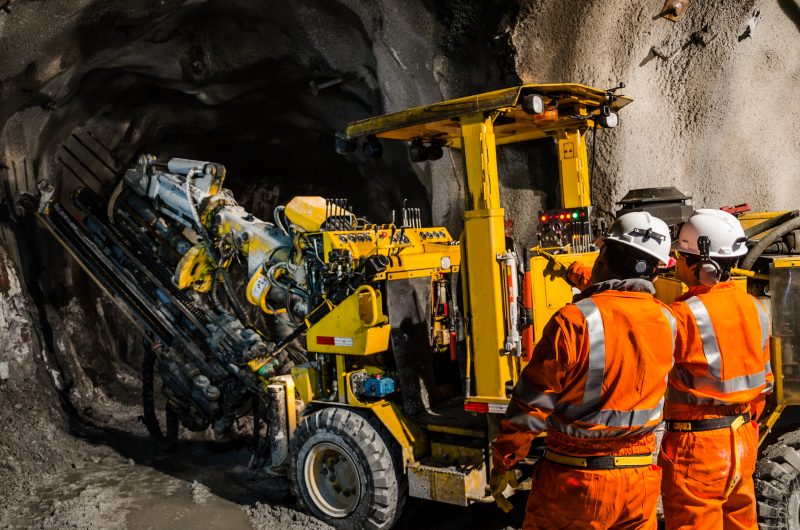
Number employed: 1,460Employment per 1,000 workers: 5.45
