
- The Bureau of Economic Analysis recently released its estimates of the relative cost of living in America’s metropolitan and rural areas in 2017.
- Among the 15 most expensive metro areas, nine were in California.
- The top spot went to San Jose, California.
- Visit Business Insider’s homepage for more stories.
The Bureau of Economic Analysis recently released its annual estimates of the relative cost of living in America’s metropolitan and rural areas.
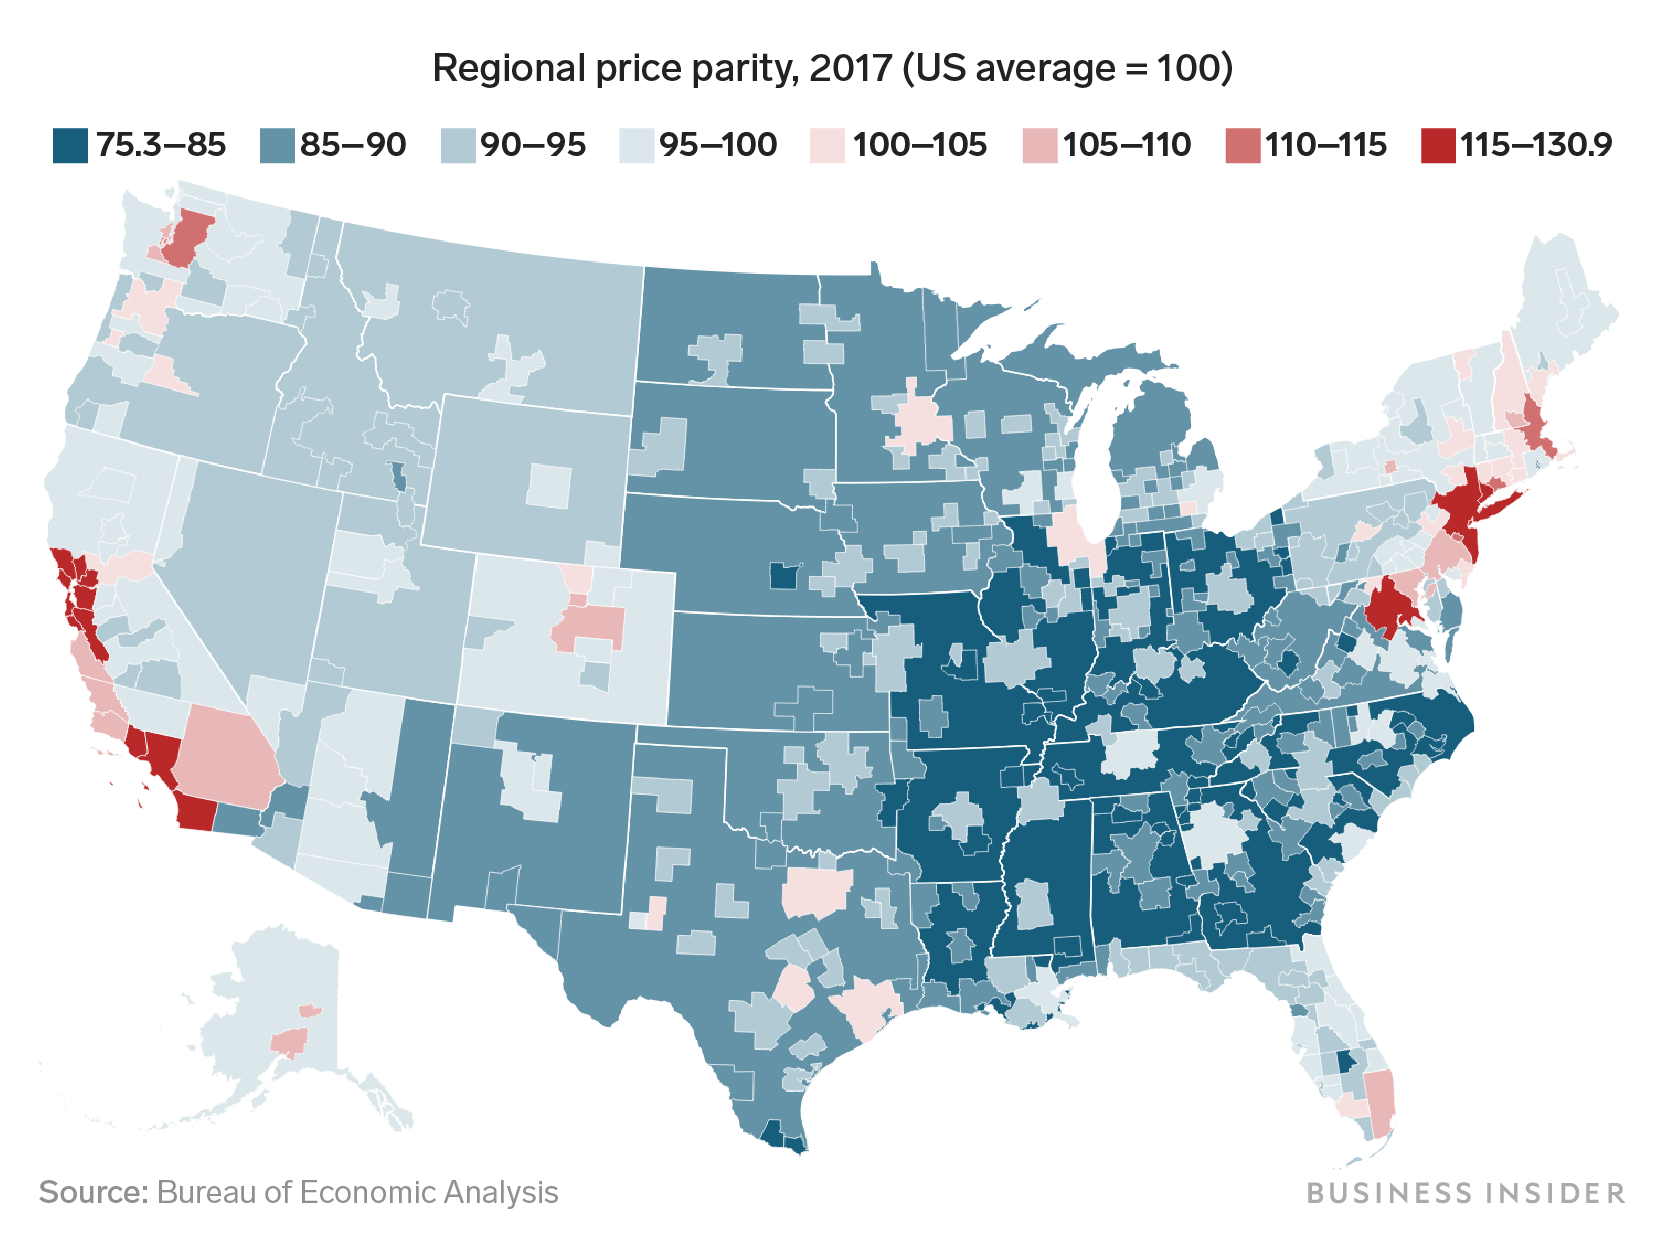
Specifically, the BEA published its regional price parities for 2017. These compare the price levels for various goods and services in different areas to the average national price.
For example, the New York-Newark-Jersey City metro area had a regional price parity of 122.3. That means that the overall price level in and around New York City for housing, goods, and services was about 22% higher than the overall country. (As a side note, the New York area dropped from fifth to seventh most expensive city.)
Read more: The most affordable small town in every state
The map above shows regional price parities for each of America's 383 metropolitan areas and the non-metropolitan areas of states. Regions in blue were less expensive than the national average, and regions in red were more expensive.
Coastal cities, particularly those on the West Coast, tended to be more expensive than the rest of the country. Nine of the 15 most expensive metro areas were in California.
Here are the 15 metro areas with the highest cost of living, according to the BEA:
T14. Boston-Cambridge-Newton, MA-NH, had a price level 11.8% higher than the national average.

T14. Seattle-Tacoma-Bellevue, WA, had a price level 11.8% higher than the national average.

13. San Diego-Carlsbad, CA, had a price level 16.0% higher than the national average.

T11. Los Angeles-Long Beach-Anaheim, CA, had a price level 17.1% higher than the national average.

T11. Oxnard-Thousand Oaks-Ventura, CA, had a price level 17.1% higher than the national average.

10. Washington-Arlington-Alexandria, DC-VA-MD-WV, had a price level 18.4% higher than the national average.

9. Bridgeport-Stamford-Norwalk, CT, had a price level 19.1% higher than the national average.

8. Vallejo-Fairfield, CA, had a price level 20.0% higher than the national average.

7. New York-Newark-New Jersey, NY-NJ-PA, had a price level 22.3% higher than the national average.

6. Santa Rosa, CA, had a price level 23.5% higher than the national average.

5. Napa, CA, had a price level 23.6% higher than the national average.

4. Honolulu, HI, had a price level 24.7% higher than the national average.

3. Santa Cruz-Watsonville, CA, had a price level 27.6% higher than the national average.

2. San Francisco-Oakland-Hayward, CA, had a price level 28.0% higher than the national average.

1. San Jose-Sunnyvale-Santa Clara, CA, had a price level 30.9% higher than the national average.
