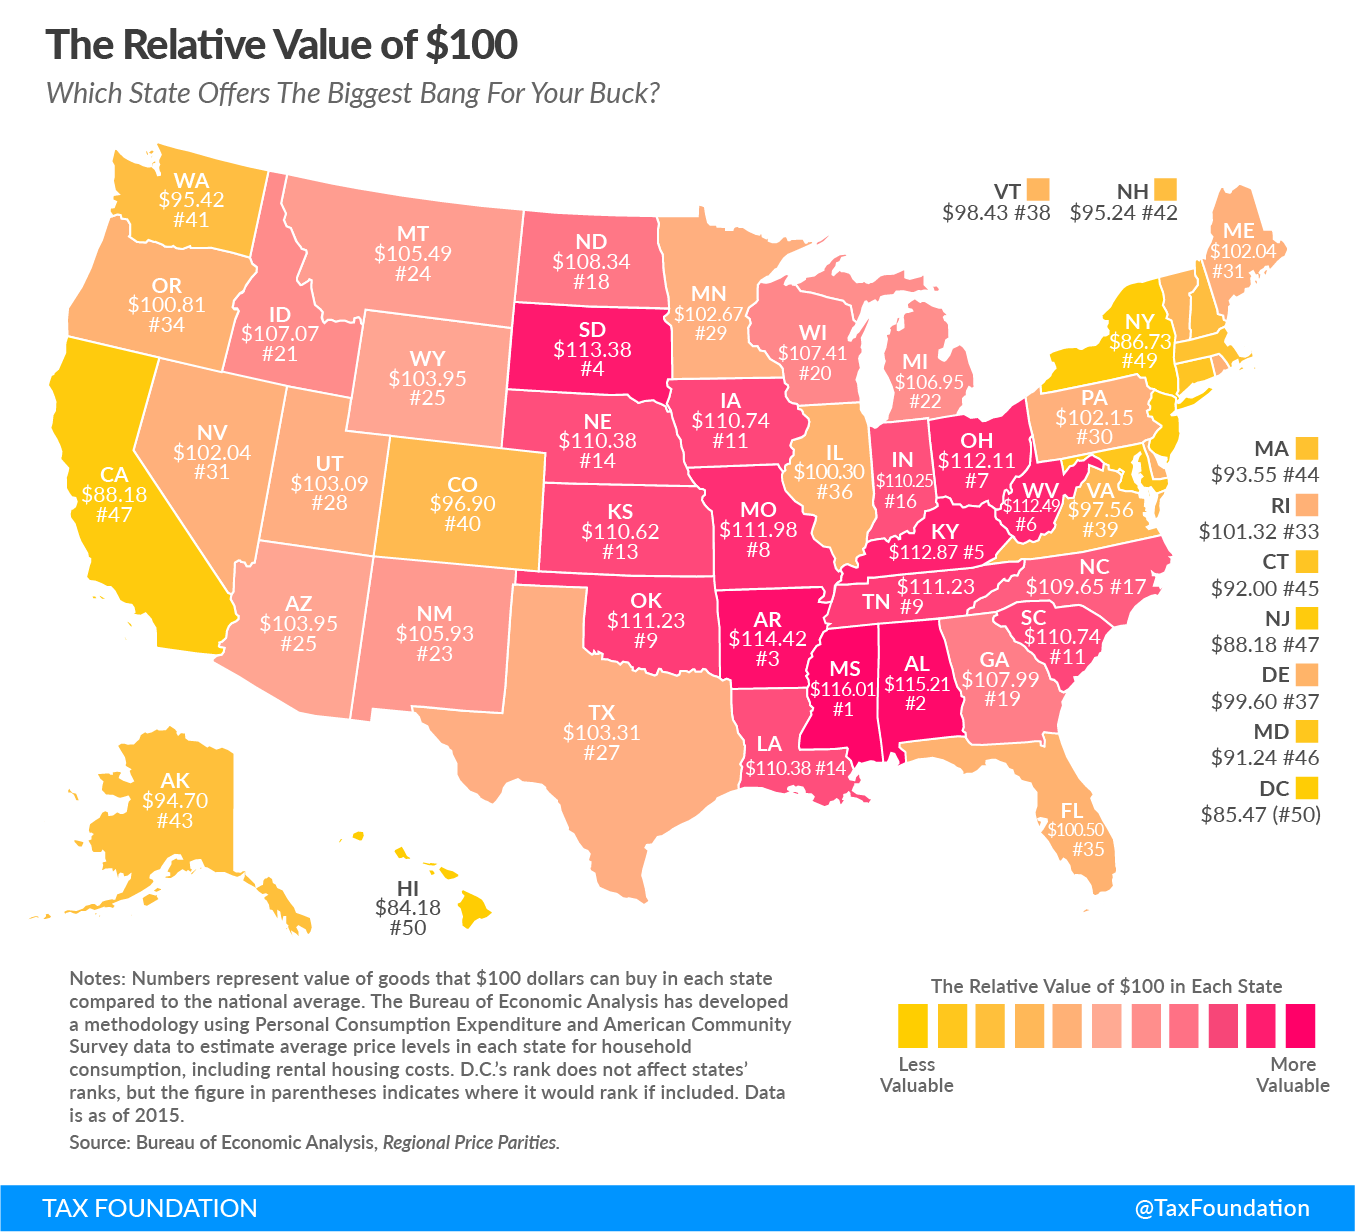
Your dollars go a lot further in some states than others.
The Tax Foundation released the latest iteration of its map showing the relative value of $100 in every state compared with the national average using data from the Bureau of Economic Analysis.
In more expensive states like California, you can afford comparatively less than average. In less expensive states like Mississippi, you can buy relatively more.
Let’s look at Ohio, which is a low-price state, as an example of what the numbers on the map mean. $100 there will buy you goods and services that would be worth $112.11 at the national average price level, according to the report.
“You could think of this as meaning that Ohioans are, for the purposes of day-to-day living, 12% richer than their incomes suggest,” the Tax Foundation’s Amir El-Sibaie said.
"Regional price differences are strikingly large; real purchasing power is 36% greater in Mississippi than it is in the District of Columbia," El-Sibaie said.
"In other words, by this measure, if you have $50,000 in after-tax income in Mississippi, you would need after-tax earnings of $68,000 in the District of Columbia just to afford the same overall standard of living."
The states with the largest relative value of $100 were:
- Mississippi ($116.01) Alabama ($115.21) Arkansas ($114.42) South Dakota ($113.38) Kentucky ($112.87)
The states with the smallest relative value of $100 were:
- District of Columbia ($85.47) Hawaii ($84.18) New York ($86.73) California ($88.18) New Jersey ($88.18)

