China’s economy led its European counterpart by leaps and bounds at the start of the Renaissance.
China was so far ahead, in fact, that economic historian Eric L. Jones once argued that the Chinese empire “came within a hair’s breadth of industrializing in the fourteenth century.”
At the start of the 15th century, China already had the compass, movable type print, and excellent naval capacity. In fact, Chinese Adm. Zheng He commanded expeditions to Southeast Asia, South Asia, Western Asia, and East Africa from about 1405 to 1433 – about a century before the Portuguese reached India. He also had ships several times the length of Christopher Columbus’ Santa Maria, the largest of Columbus’ three ships that crossed the Atlantic.
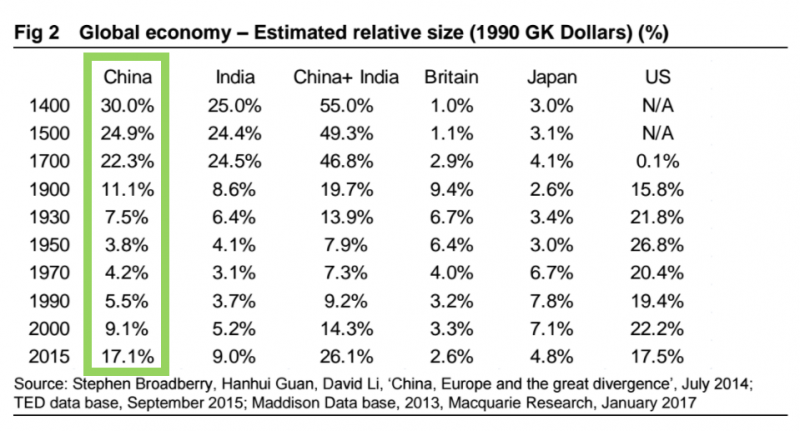
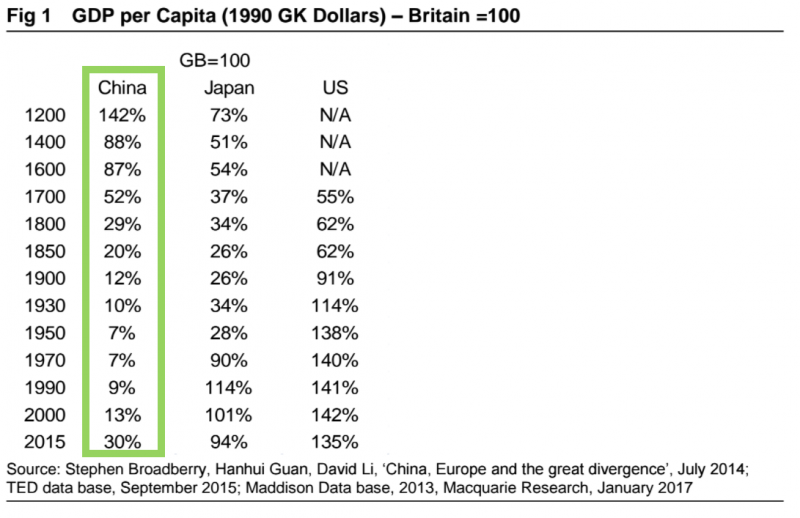
Still, it’s hard to understand the magnitude of the shift China’s economic fortunes have seen just with historical anecdotes. And so, in a recent note to clients, Macquarie Research’s Viktor Shvets included two fascinating charts, which we included below, showing the changes China saw over the past 800 years.
The first chart shows the estimated share of a given country’s economy as a part of the overall world economy.
In the 15th and 16th centuries, China accounted for 25% to 30% of the global economy, but by the 1950s and '60s, after the destruction of World War II and under the rule of Mao Zedong, it fell below 5%. Today its economy makes up about 17% of the global economy - roughly the same share as the US.

The second chart compares gross-domestic-product per capita in China, Japan, and the US to the British GDP per capita measured in 1990 US dollars. In this case, the British GDP per capita in each year is 100, so if a number from China, Japan, or the US is above 100, then its GDP per capita is greater than in Britain, and if the number falls below 100, per capita output is lower than that in Britain.
As Shvets writes, on a per capita basis, China was the wealthiest part of the world from 1200 to the 1300s - aside from Italy. Even as late as the 1600s it was roughly on par with the Brits. After that, however, the GDP per capita relative to Britain declined all the way up to the 1970s, when it was below 10% of the British standard of living. In about 1990, it starts to pick up again, but it has yet to recover to levels seen from 1200 to 1600.
Interestingly, Japan also followed a downward trajectory from 1200 to the 1950s - when its GDP per capita was about 28% of the UK's following its defeat in World War II. But unlike in China, GDP per capita in Japan bounced back quickly, and its GDP per capita from 1970 to today is roughly comparable to Britain's.

One other thing that stands out is that while the size of China's economy today rivals the US's, its GDP per capita is still much lower. At the same time, while Japan's share of the global economy is significantly smaller than those of both the US and China, its GDP per capita is roughly on par with the UK's - and far greater than China's.
Putting the two charts together, Shvets added that "most of the relative and absolute decline occurred from the 18th century onwards, coinciding with the accelerating pace of industrial revolutions, which ushered the modern age of much faster productivity growth rates."

