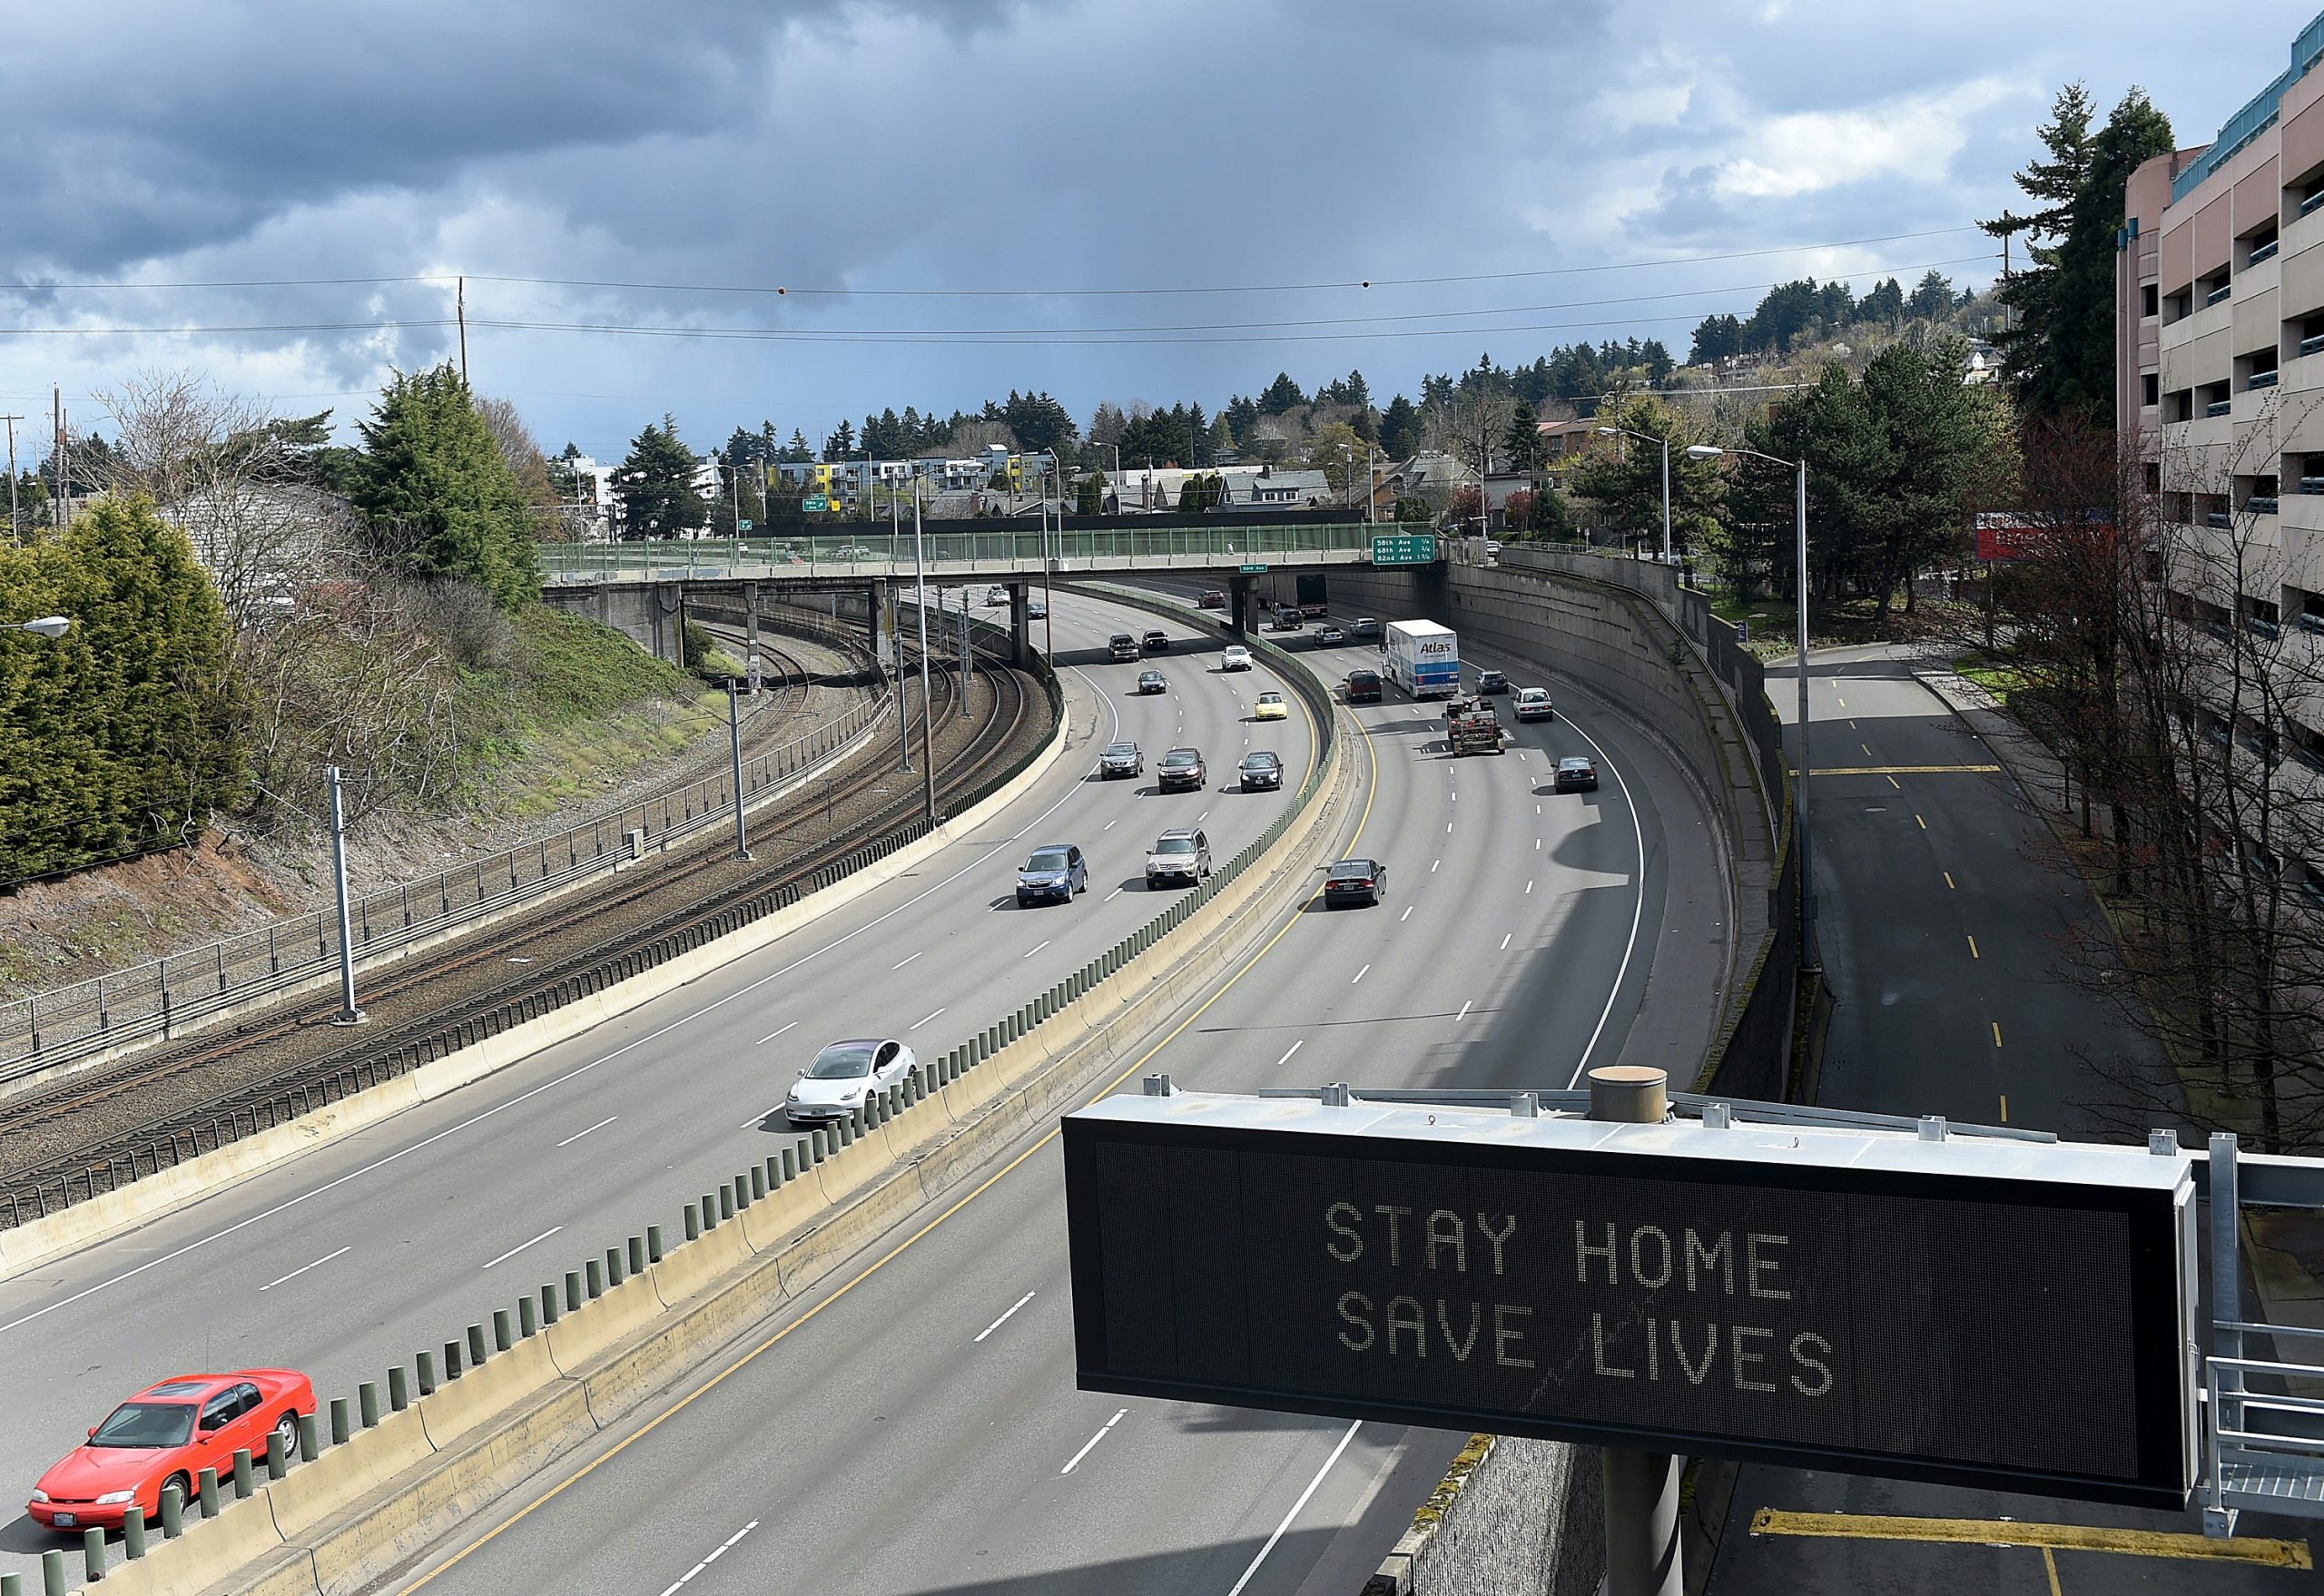
- Travel speeds across the US have skyrocketed as traffic has virtually disappeared due to the coronavirus pandemic, according to data from analytics firm Inrix.
- Between late February and early April, commute speeds increased significantly across 25 metropolitan areas studied by Inrix.
- San Francisco and Los Angeles both saw a roughly 60% jump in highway and expressway speeds during evening rush hour.
- Visit Business Insider’s homepage for more stories.
Travel speeds on major US roadways have risen sharply as the coronavirus pandemic and related lockdowns have forced would-be commuters to stay home. Roads are so empty, in fact, that areas like San Francisco and Los Angeles have seen a roughly 60% jump in highway speeds during evening rush hour.
That’s according to Inrix, a Kirkland, Washington-based analytics firm that recently studied just how fast drivers are going now that the roads are theirs and theirs alone. Inrix analyzed travel speeds on highways and expressways in 25 metropolitan areas, comparing morning and evening rush-hour speeds during the week of April 6 to rush-hour speeds during a control week in late February, before things got really bad in the US.
Across the board, travel speeds during typical morning and evening commute times were measurably higher in April than in February. The change in average speed ranged from 6% up to 60%, depending on the location and time of day.
Bob Pishue, a transportation analyst at Inrix, told Business Insider the areas that typically have the most congestion generally saw the most drastic bumps in average speed.
Seattle, the initial epicenter of the coronavirus pandemic in the US, was among the first cities to see this rapid shift in travel behavior, Pishue said. Traffic there virtually evaporated overnight after major employers in the area - including Amazon and Microsoft - told employees to begin working from home in early March.
Now, as roughly 95% of Americans are under some form of stay-at-home order, congestion on major roadways has all but disappeared - likewise, travel speeds during peak commute times have skyrocketed.
These are the 25 US metropolitan areas Inrix studied, ranked according to the average speed increase observed during evening rush hour on the week of April 6 through 10.
St. Louis — 13% faster

Morning rush hour: 66 mph, 13% faster than usual
Evening rush hour: 67 mph, 13% faster than usual
Minneapolis-St. Paul — 14% faster

Morning rush hour: 61 mph, 6% faster than usual
Evening rush hour: 61 mph, 14% faster than usual
Phoenix — 15% faster

Morning rush hour: 65 mph, 9% faster than usual
Evening rush hour: 65 mph, 15% faster than usual
Sacramento, California — 19% faster

Morning rush hour: 57 mph, 8% faster than usual
Evening rush hour: 58 mph, 19% faster than usual
Chicago — 20% faster

Morning rush hour: 58 mph, 11% faster than usual
Evening rush hour: 59 mph, 20% faster than usual
Philadelphia — 21% faster

Morning rush hour: 56 mph, 14% faster than usual
Evening rush hour: 56 mph, 21% faster than usual
Charlotte, North Carolina — 24% faster

Morning rush hour: 62 mph, 12% faster than usual
Evening rush hour: 62 mph, 24% faster than usual
Denver — 24% faster

Morning rush hour: 62 mph, 13% faster than usual
Evening rush hour: 62 mph, 24% faster than usual
Washington, DC — 27% faster

Morning rush hour: 57 mph, 22% faster than usual
Evening rush hour: 56 mph, 27% faster than usual
Boston — 29% faster

Morning rush hour: 61 mph, 33% faster than usual
Evening rush hour: 60 mph, 29% faster than usual
San Antonio — 31% faster

Morning rush hour: 64 mph, 13% faster than usual
Evening rush hour: 64 mph, 31% faster than usual
Seattle — 31% faster

Morning rush hour: 59 mph, 23% faster than usual
Evening rush hour: 59 mph, 31% faster than usual
Baltimore — 32% faster

Morning rush hour: 58 mph, 30% faster than usual
Evening rush hour: 58 mph, 32% faster than usual
Detroit — 32% faster

Morning rush hour: 55 mph, 11% faster than usual
Evening rush hour: 57 mph, 32% faster than usual
Portland, Oregon — 32% faster

Morning rush hour: 54 mph, 20% faster than usual
Evening rush hour: 55 mph, 32% faster than usual
Atlanta — 33% faster

Morning rush hour: 61 mph, 26% faster than usual
Evening rush hour: 58 mph, 33% faster than usual
Dallas — 34% faster

Morning rush hour: 62 mph, 19% faster than usual
Evening rush hour: 61 mph, 34% faster than usual
San Diego — 34% faster

Morning rush hour: 64 mph, 20% faster than usual
Evening rush hour: 64 mph, 34% faster than usual
Orlando, Florida — 35% faster

Morning rush hour: 56 mph, 12% faster than usual
Evening rush hour: 57 mph, 35% faster than usual
Miami — 38% faster

Morning rush hour: 58 mph, 26% faster than usual
Evening rush hour: 61 mph, 38% faster than usual
New York — 40% faster

Morning rush hour: 54 mph, 32% faster than usual
Evening rush hour: 55 mph, 40% faster than usual
Houston — 44% faster

Morning rush hour: 64 mph, 26% faster than usual
Evening rush hour: 62 mph, 44% faster than usual
Tampa, Florida — 44% faster

Morning rush hour: 56 mph, 11% faster than usual
Evening rush hour: 58 mph, 44% faster than usual
Los Angeles — 59% faster

Morning rush hour: 60 mph, 46% faster than usual
Evening rush hour: 59 mph, 59% faster than usual
San Francisco — 60% faster

Morning rush hour: 58 mph, 51% faster than usual
Evening rush hour: 57 mph, 60% faster than usual

