
- The convergence of escalating coronavirus fears and an oil-price war has driven market activity not seen since the financial crisis.
- Monday, March 9 featured a particularly vicious bout of volatility as the S&P 500 closed down nearly 8%, while massive inflows to US Treasurys pushed the entire yield curve below 1% for the first time in history.
- The S&P 500 has now fallen roughly 18% from a recent record high reached on Feb. 19, while Treasury yields have repeatedly hit fresh all-time lows.
- Gold – historically viewed as a safe haven asset – has reached multiyear highs.
- Here are five charts revealing the intensity of recent market volatility.
- Visit the Business Insider homepage for more stories.
The historically sharp sell-off in oil prices this week was just the latest entry to a growing list of chaotic market occurrences that haven’t been seen in years – or even decades.
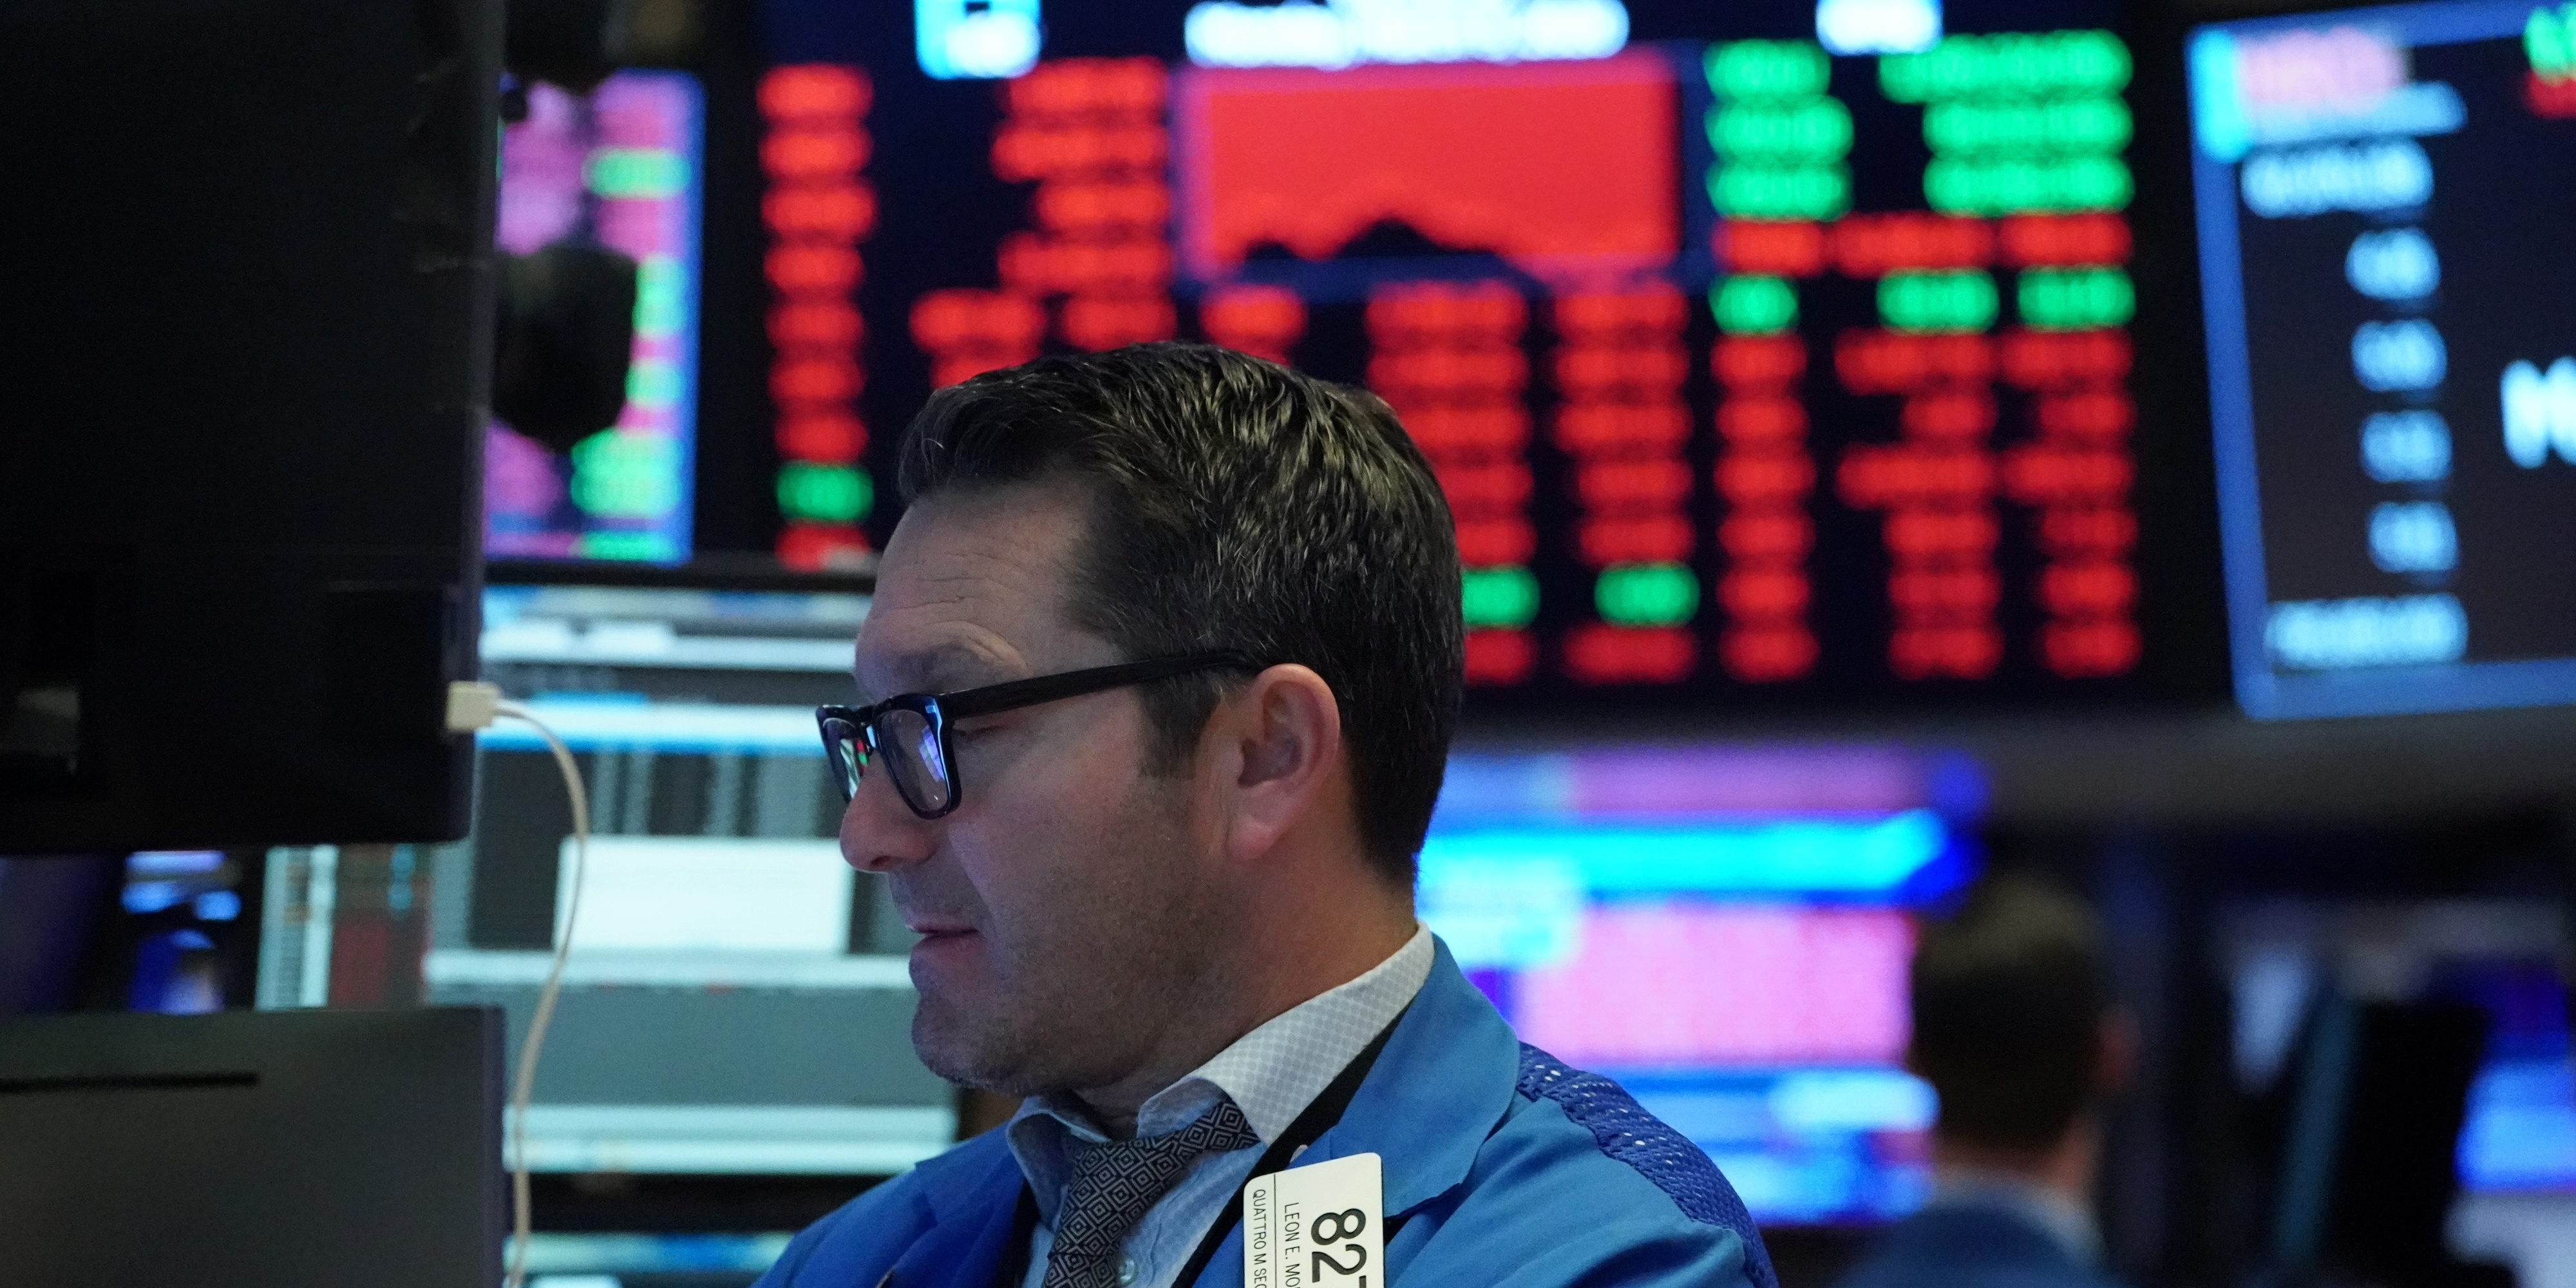
Few assets have avoided the massive surge in volatility that’s gripped the landscape in recent weeks. The US stock market is fresh of its biggest single-day decline in 12 years. Meanwhile, investors’ hunger for the safety of government bonds has pushed Treasury yields to repeated record lows and sent gold to all-time highs.
The market turmoil has primarily been fueled by the rapidly spreading coronavirus and the devastating impact it’s expected to have on economies worldwide. Global supply chains have broken down, consumers are hesitant to spend, and there doesn’t appear to be an easy fix for any of it.
The sudden introduction of a global oil-price conflict between Russia and Saudi Arabia has also shaken investor nerves. Their inability to agree on production cuts prompted a 31% crude sell-off, its biggest intraday drop since the Gulf War in 1991. That then, in turn, rattled risk assets of all types.
Even during periods of relief for risk assets - like the one seen during the morning of Tuesday, March 10 - there's an underlying sense of worry pervading investor activity, threatening to wipe out gains at the sight of any moderately negative headline.
Listed below are five charts showing the drastic nature recent market-wide price swings.
OIL — Biggest drop since 1991

Oil faced the brunt of the weekend's price war news. The world's most actively traded commodity slumped as much as 32% before recovering some losses and closing down about 24%.
The plunge was oil's second-largest intraday drop in history, trailing only behind the slump seen at the start of the Gulf War in 1991.
US STOCKS — Worst single-day plunge since 2008

US equities have been under pressure in recent weeks as the coronavirus's threat to global growth intensified. The S&P 500 entered correction territory on February 27 days after the virus sell-off began and continued to sink on mounting concerns of near-term recession.
Monday's oil-market slide only exacerbated stocks' downward trend. The benchmark index tanked 7% at the open and triggered a trading halt just minutes into the day's session. Stocks initially trended higher after the 15-minute pause but ended the day down 7.6%. The decline was the S&P 500's worst since December 2008.
TREASURY YIELDS — Entire curve below 1%

While risk assets saw the most selling activity in more than a decade, investors ran to the few insulated assets they could find. Chief among them were US Treasury bonds, historically popular safe havens that have seen mass inflows since the coronavirus sell-off began in late February.
Monday's turmoil pushed yields for Treasurys to record lows across notes. Yields fall when bond prices rise, and the surge in investor interest pushed the asset's prices to new highs. The yield curve, which plots the yields of Treasurys with different maturities, sank below 1% for the first time ever.
VOLATILITY — VIX at highest since the financial crisis

The most direct indicator of stocks' uptick in volatility was displayed by Cboe's VIX index, the market's preferred gauge of broad volatility. The tool uses S&P 500 options prices to measure investor sentiments and anticipated market risk. When outsized buying or selling occurs, the VIX typically spikes.
The so-called "fear gauge" skyrocketed through Monday's session and hit a peak of 62 before closing at 51. The intraday high was the loftiest reading since December 2008, marking another sign of the financial crisis-level activity.
GOLD — 7-year high

A traditional hedge bet for market downturns, gold soared through Monday's session. The precious metal peaked at $1,703.39 per ounce, crossing a key threshold and reaching its highest level since 2013.
Gold has since fallen while risk assets recover in Tuesday trading, but the metal remains up 9% year-to-date as coronavirus fears prop up its value.
Now read more markets coverage from Markets Insider and Business Insider:
The price war in oil escalates as both Russia and Saudi Arabia threaten to boost output